TIME ON MARKET FELL MONTH OVER MONTH IN APRIL 2026
CCRSI RELEASE – May 2026
(With data through April 2026)
This month's CoStar Commercial Repeat Sale Indices (CCRSI) provides the market's first look at commercial real estate pricing trends through April 2026. Based on 1,559 repeat sale pairs in April 2026 and 345,744 repeat sales since 1996, the CCRSI offers the broadest measure of commercial real estate repeat sales activity.
CCRSI National Results Highlights
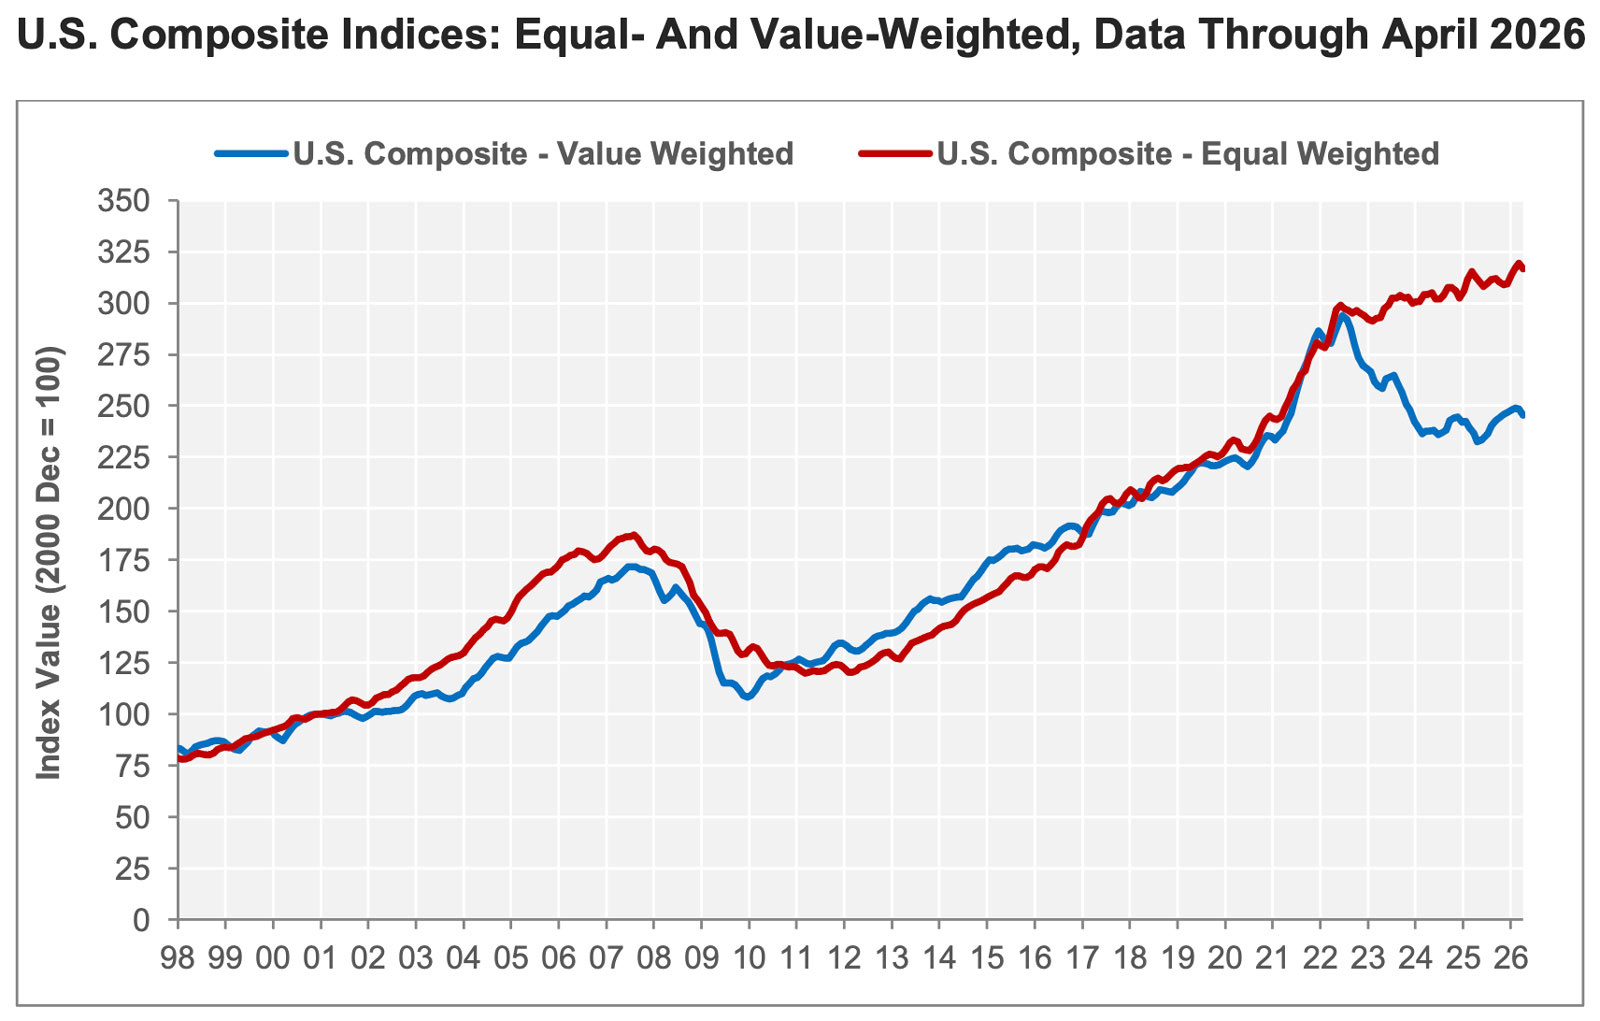
- U.S. COMPOSITE PRICE INDICES ROSE IN MARCH 2026. The value-weighted U.S. Composite Index, which is more heavily influenced by high-value trades common in core markets, increased 0.2% over the prior month to 249 in March 2026, the 10th consecutive month of gains. Year-over-year values climbed 3.8% in March 2026. Prices in this cohort continue to claw back the declines seen a few years ago, now sitting at 15.4% below the July 2022 all-time high.
- Meanwhile, the equal-weighted U.S. Composite Index, which reflects the more numerous but lower-priced property sales typical of secondary and tertiary markets, rose 0.9% over the prior month to 320 in March 2026. The index increased 1.3% during the 12 months ending in March 2026, posting the second consecutive month of fresh all-time highs.
- Despite seeing equal-weighted prices fluctuate between gains and losses over the last two years, the year-over-year price trends have been positive dating back to 2012 with the single exception being a 0.1% decline in June 2023.
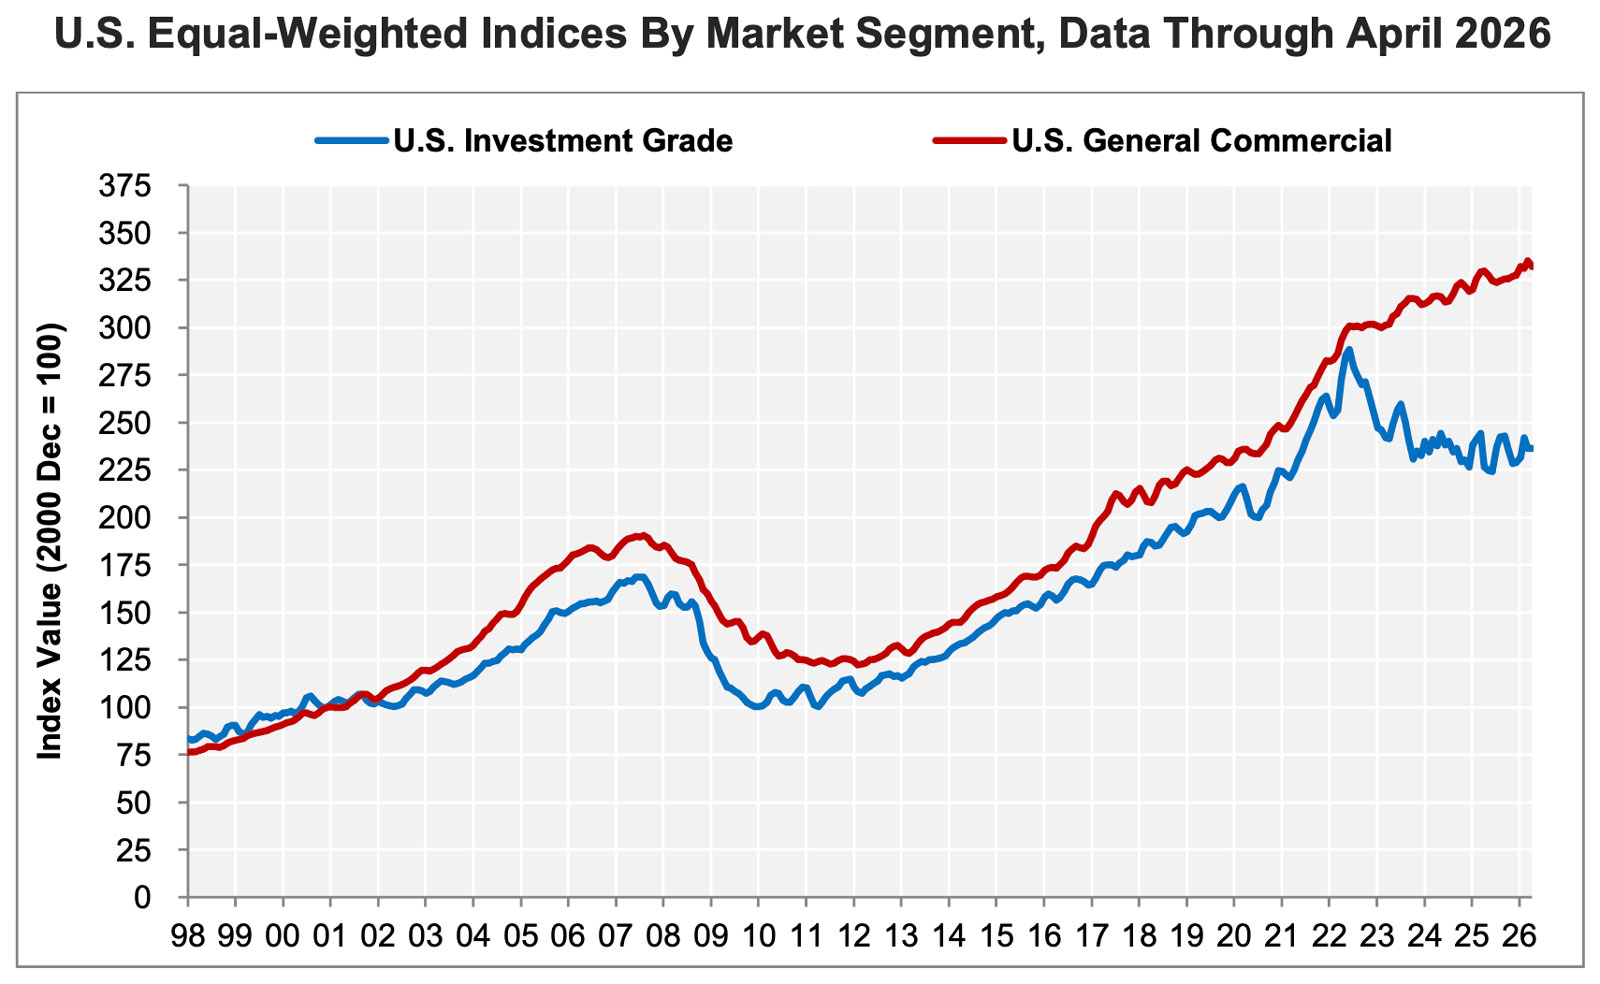
- GENERAL COMMERCIAL PRICES DECLINED MORE THAN INVESTMENT GRADE PRICES IN APRIL 2026. The equal-weighted index’s sub-components are comprised of investment grade and general commercial properties, which both declined over the prior month in April 2026.
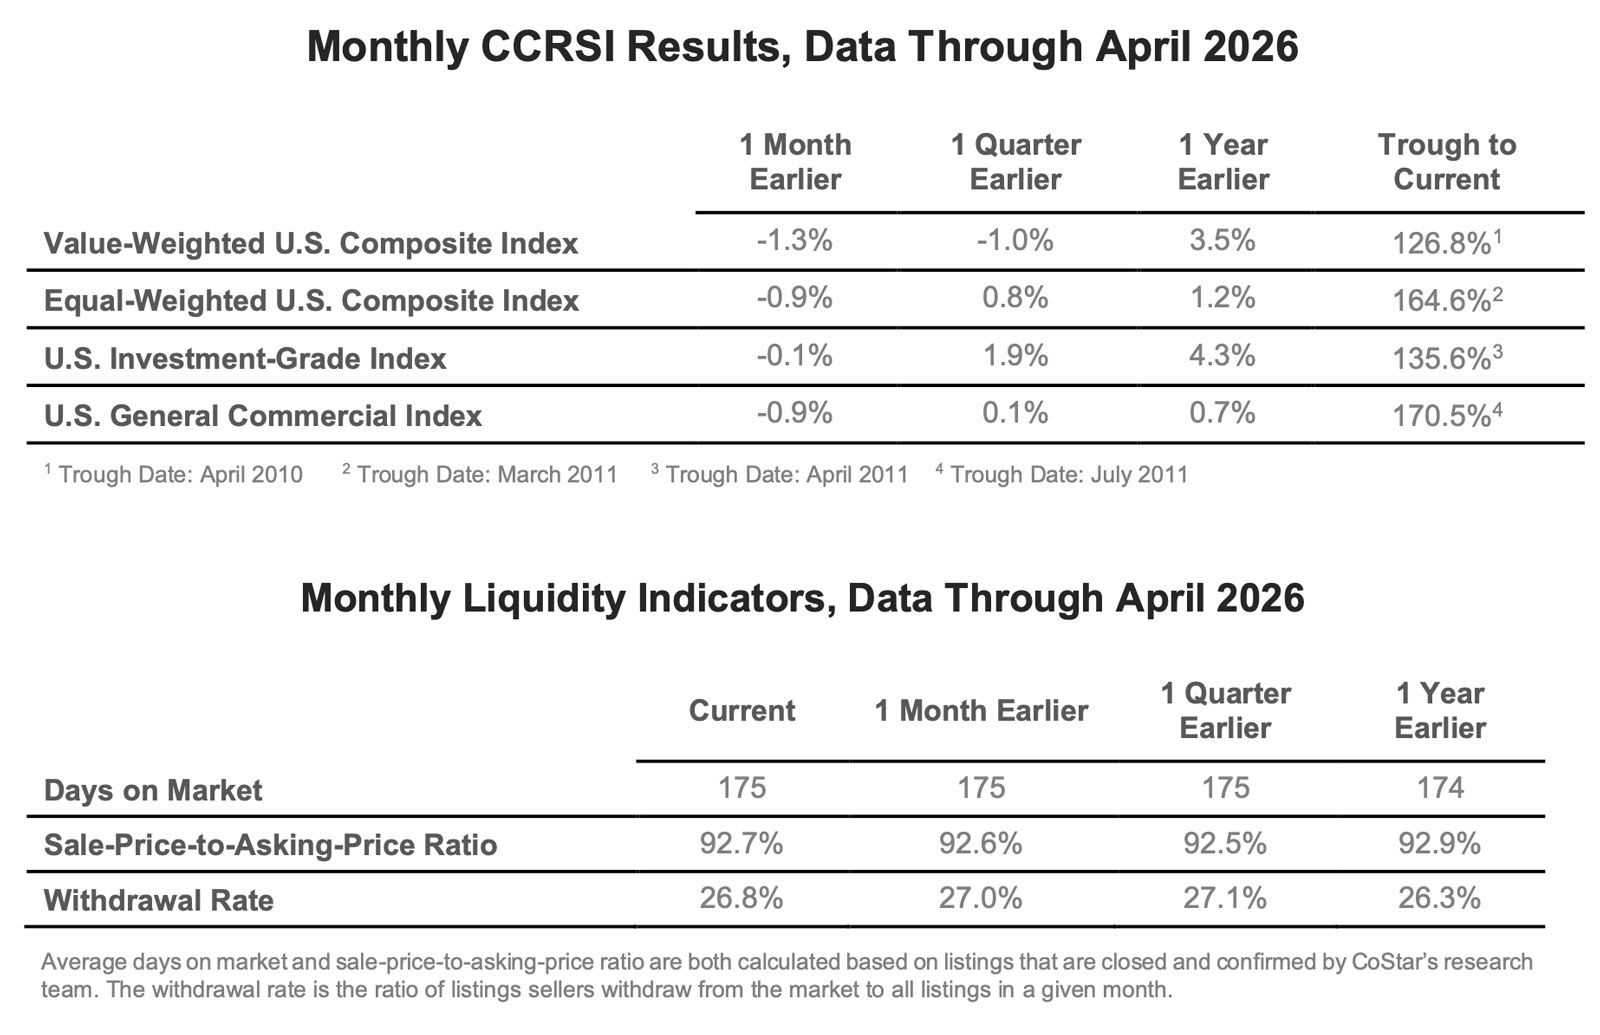
- The investment grade sub-index, more heavily influenced by higher-value assets, fell 0.1% in April 2026 compared to March 2026. Year-over-year values gained 4.3% in the 12 months ending in April 2026. The cumulative change in this sub-index was 18.1% below the June 2022 all-time high in April 2026.
- The general commercial sub-index, more heavily influenced by smaller, lower-priced assets, declined 0.9% in April 2026 compared to March 2026. This sub-index rose 0.7% over the 12 months ending April 2026. March 2026 marked the all-time high for the general commercial sub-index.
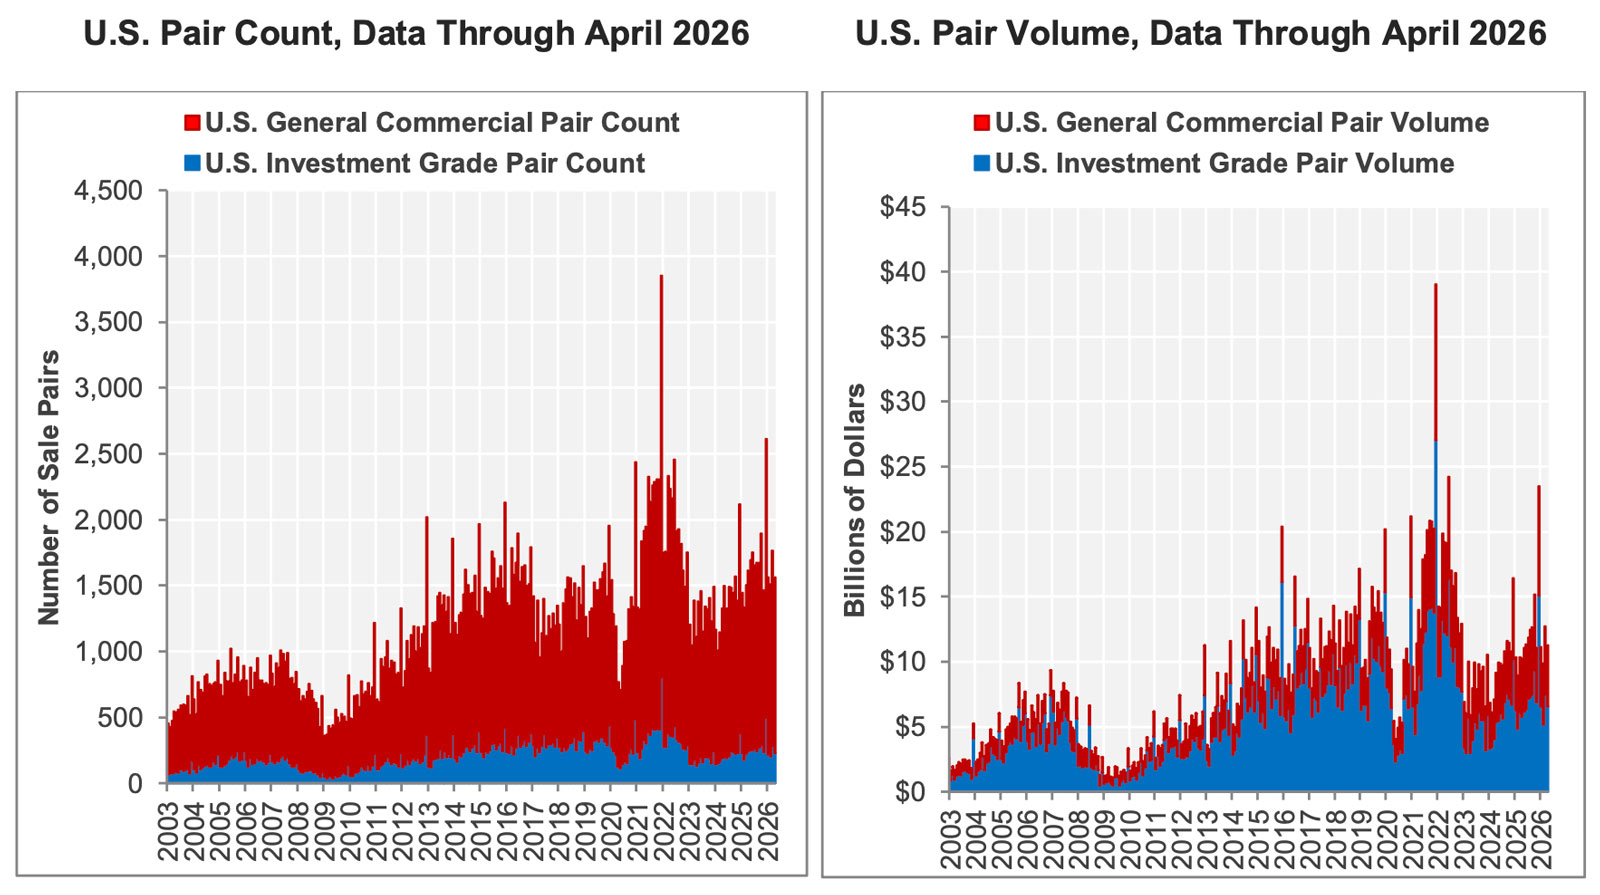
- REPEAT SALE TRANSACTIONS DECLINED COMPARED TO APRIL 2025. The number of repeat sales fell by 54 transactions compared to April 2025. With 1,559 repeat sales in April 2026, total consideration was $11.2 billion, representing a 9.6% increase over the prior year. Investment grade transaction volume rose 13.4% in April 2026 compared to the prior year reaching $6.5 billion. The general commercial segment increased 4.8% over the prior year to $4.7 billion.
- Composite pair volume of $153.9 billion during the 12 months ending in April 2026 was 17.9% above the 12-month period that ended in April 2025. The growth in sales volume was more prominent in the general commercial segment, which increased 20.4% over the 12 months that ended in April 2026 compared to the same period ending in April 2025. The general commercial segment accounted for 41.8% of the overall transaction volume during the 12 months that ended in April 2026. The investment grade segment, which accounted for 58.2% of the 12-month transaction volume, increased 16.3% over the 12 months ending in April 2026.
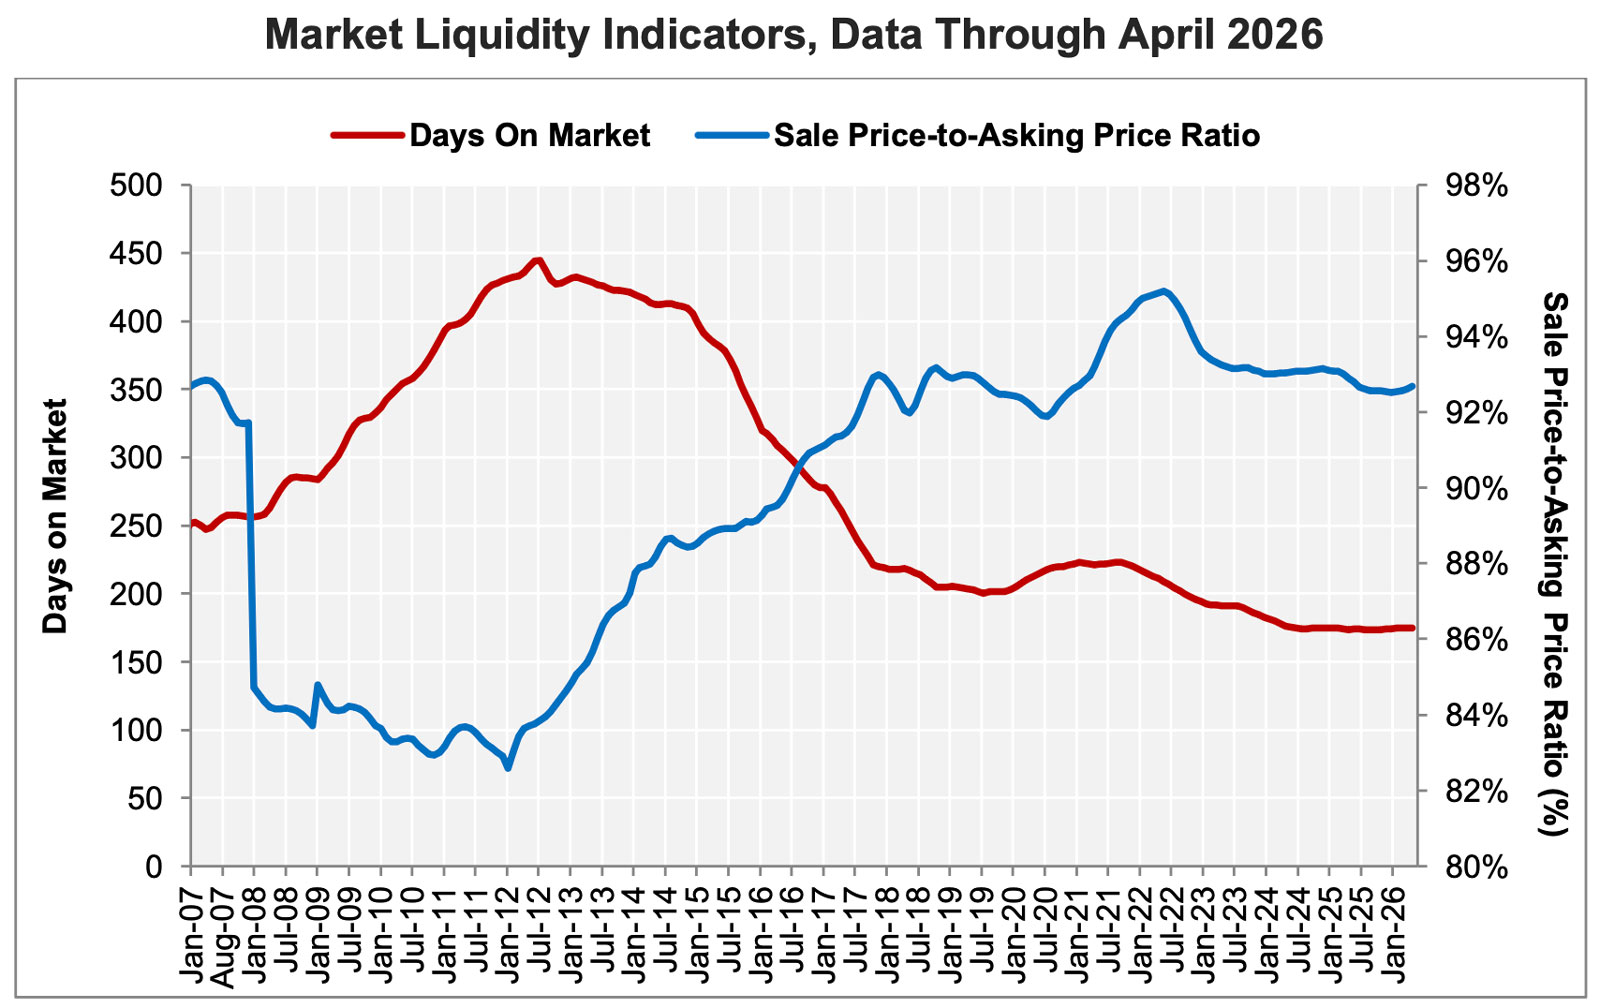
- THE AVERAGE TIME ON MARKET DECLINED IN APRIL 2026. The average time on the market of for-sale properties fell during the prior two months but was higher by 0.7% to 174.8 days in the 12 months ending in April 2026. The sale price-to-asking-price ratio fell to 92.7% in the same period. At the same time, the share of properties withdrawn from the market by discouraged sellers rose to 26.8% in April 2026 compared to April 2025. Collectively, each of these trends saw improvement in recent months but deteriorated compared to one year ago.
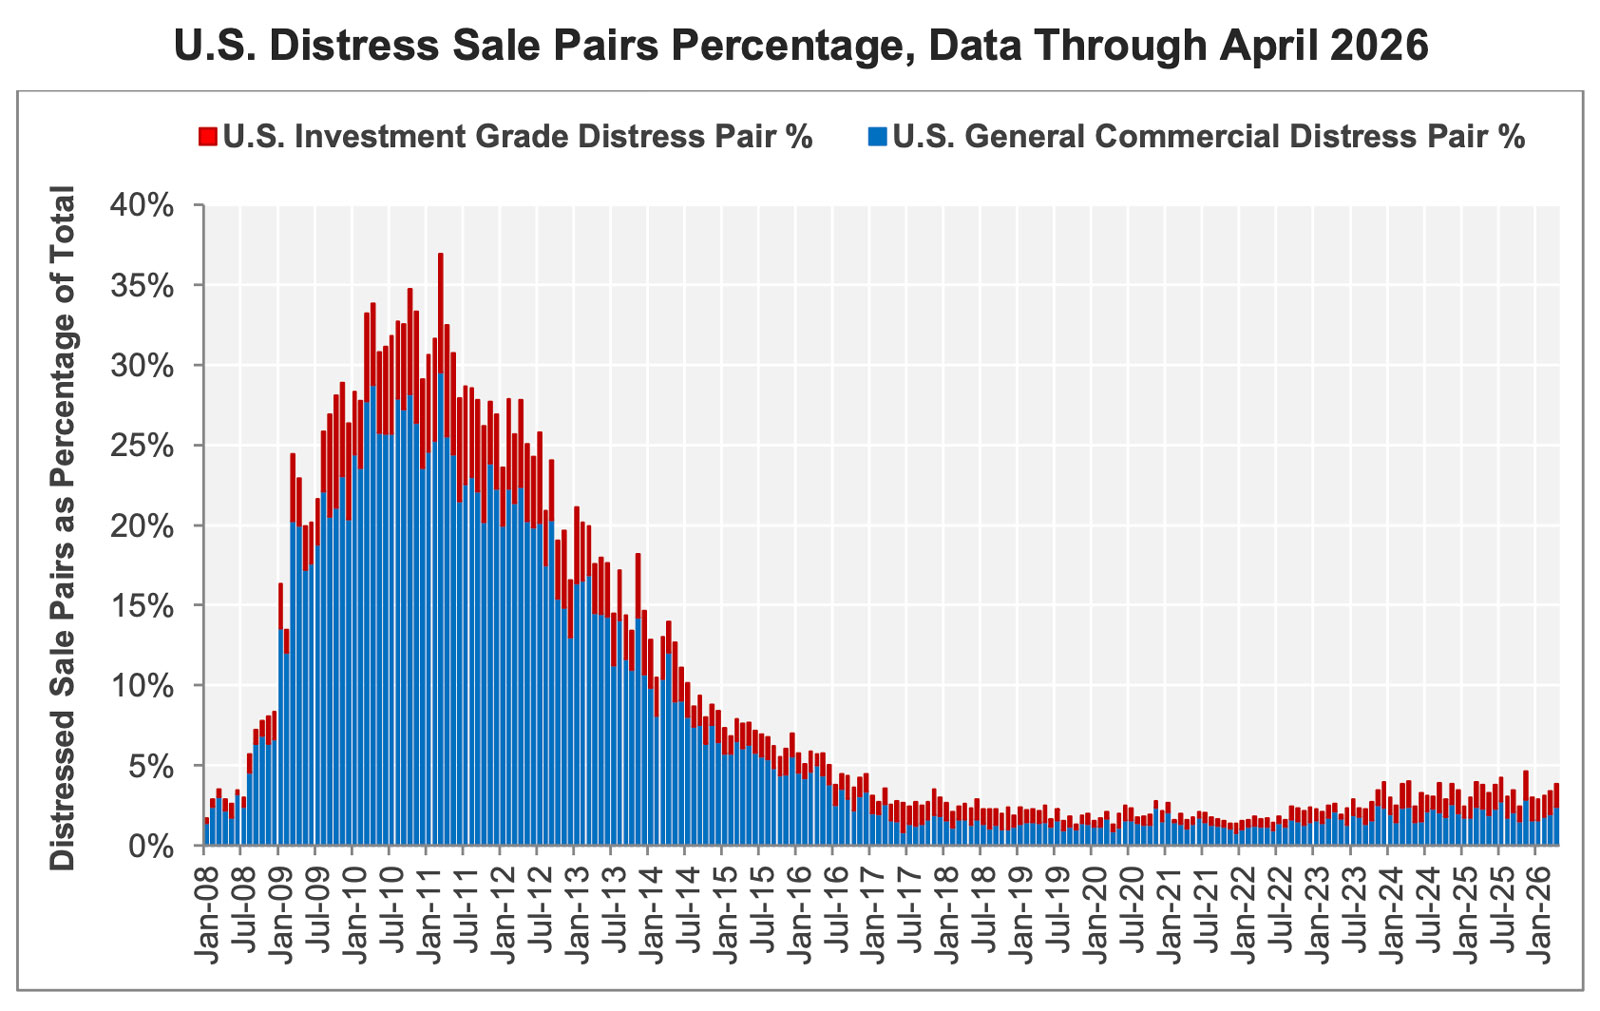
- DISTRESSED REPEAT SALES WERE LITTLE CHANGED IN APRIL 2026. A total of 60 repeat sales out of the 1,559 trades in April 2026, or 3.8%, were distressed sales. This compares to 61 distressed repeat sales in April 2025. General commercial distressed sales accounted for 38 of the trades in April 2026, or 2.9% of general commercial repeat-sale trades. 22 investment-grade distressed sales were recorded in April 2026, accounting for 9.6% of investment grade repeat sales.
About The CoStar Commercial Repeat-Sale Indices
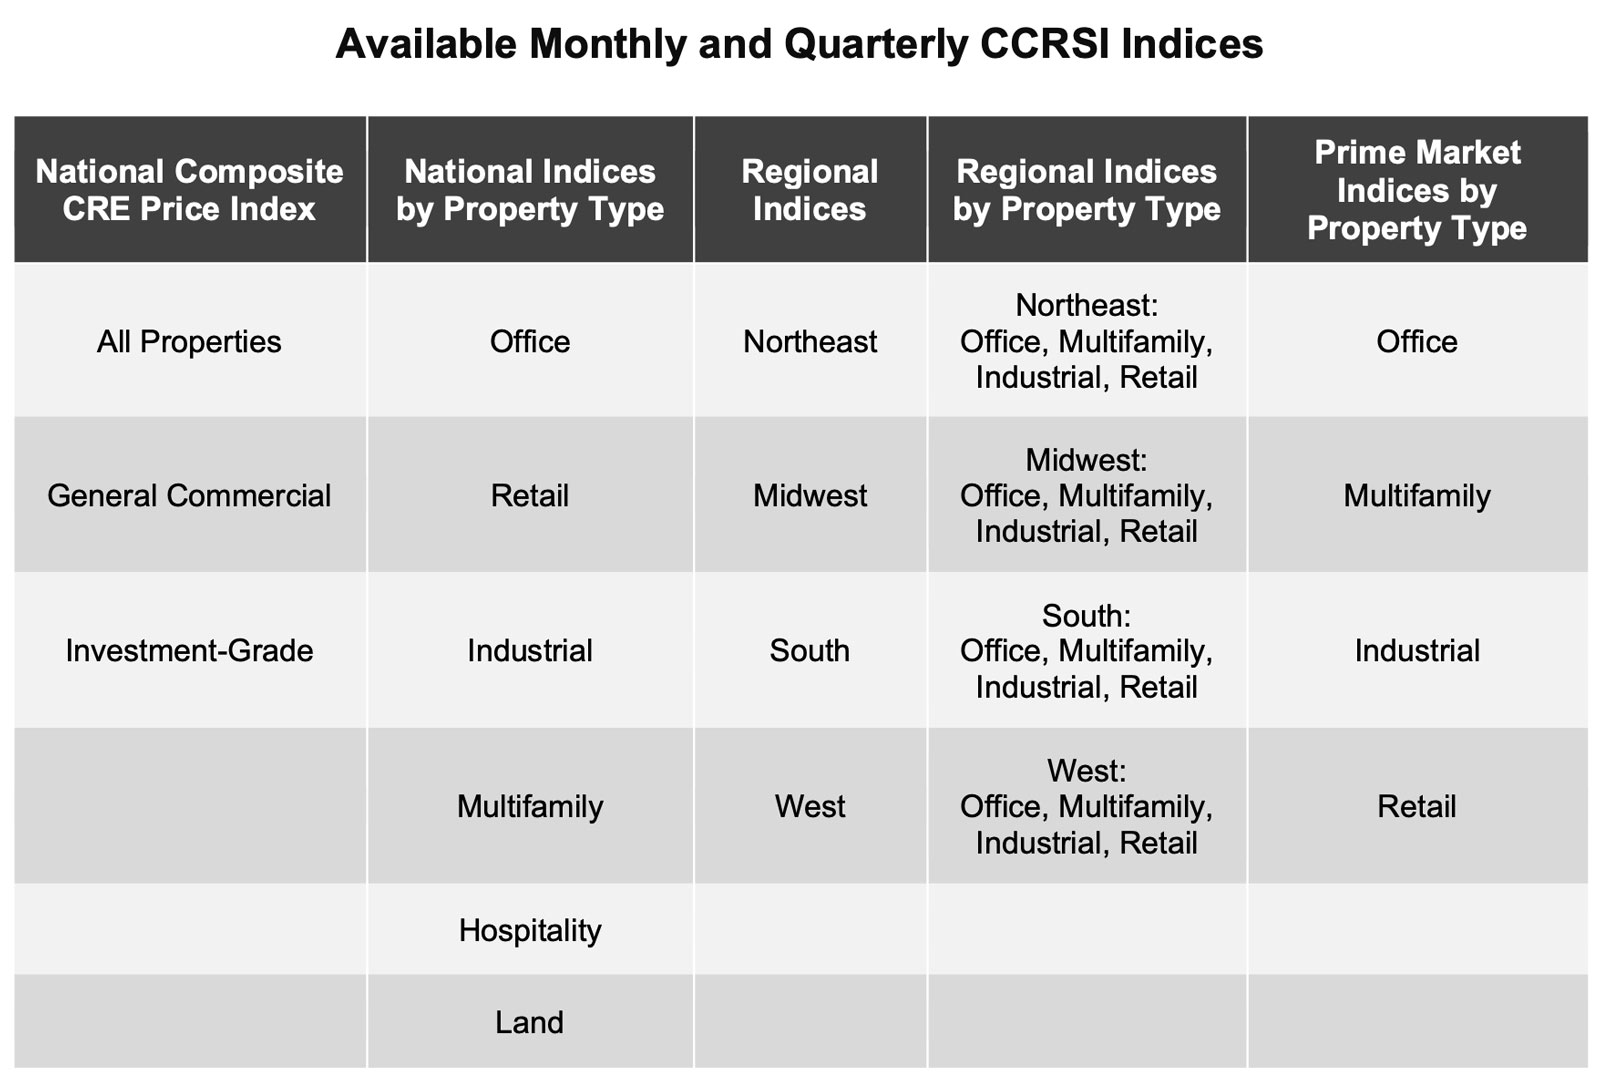
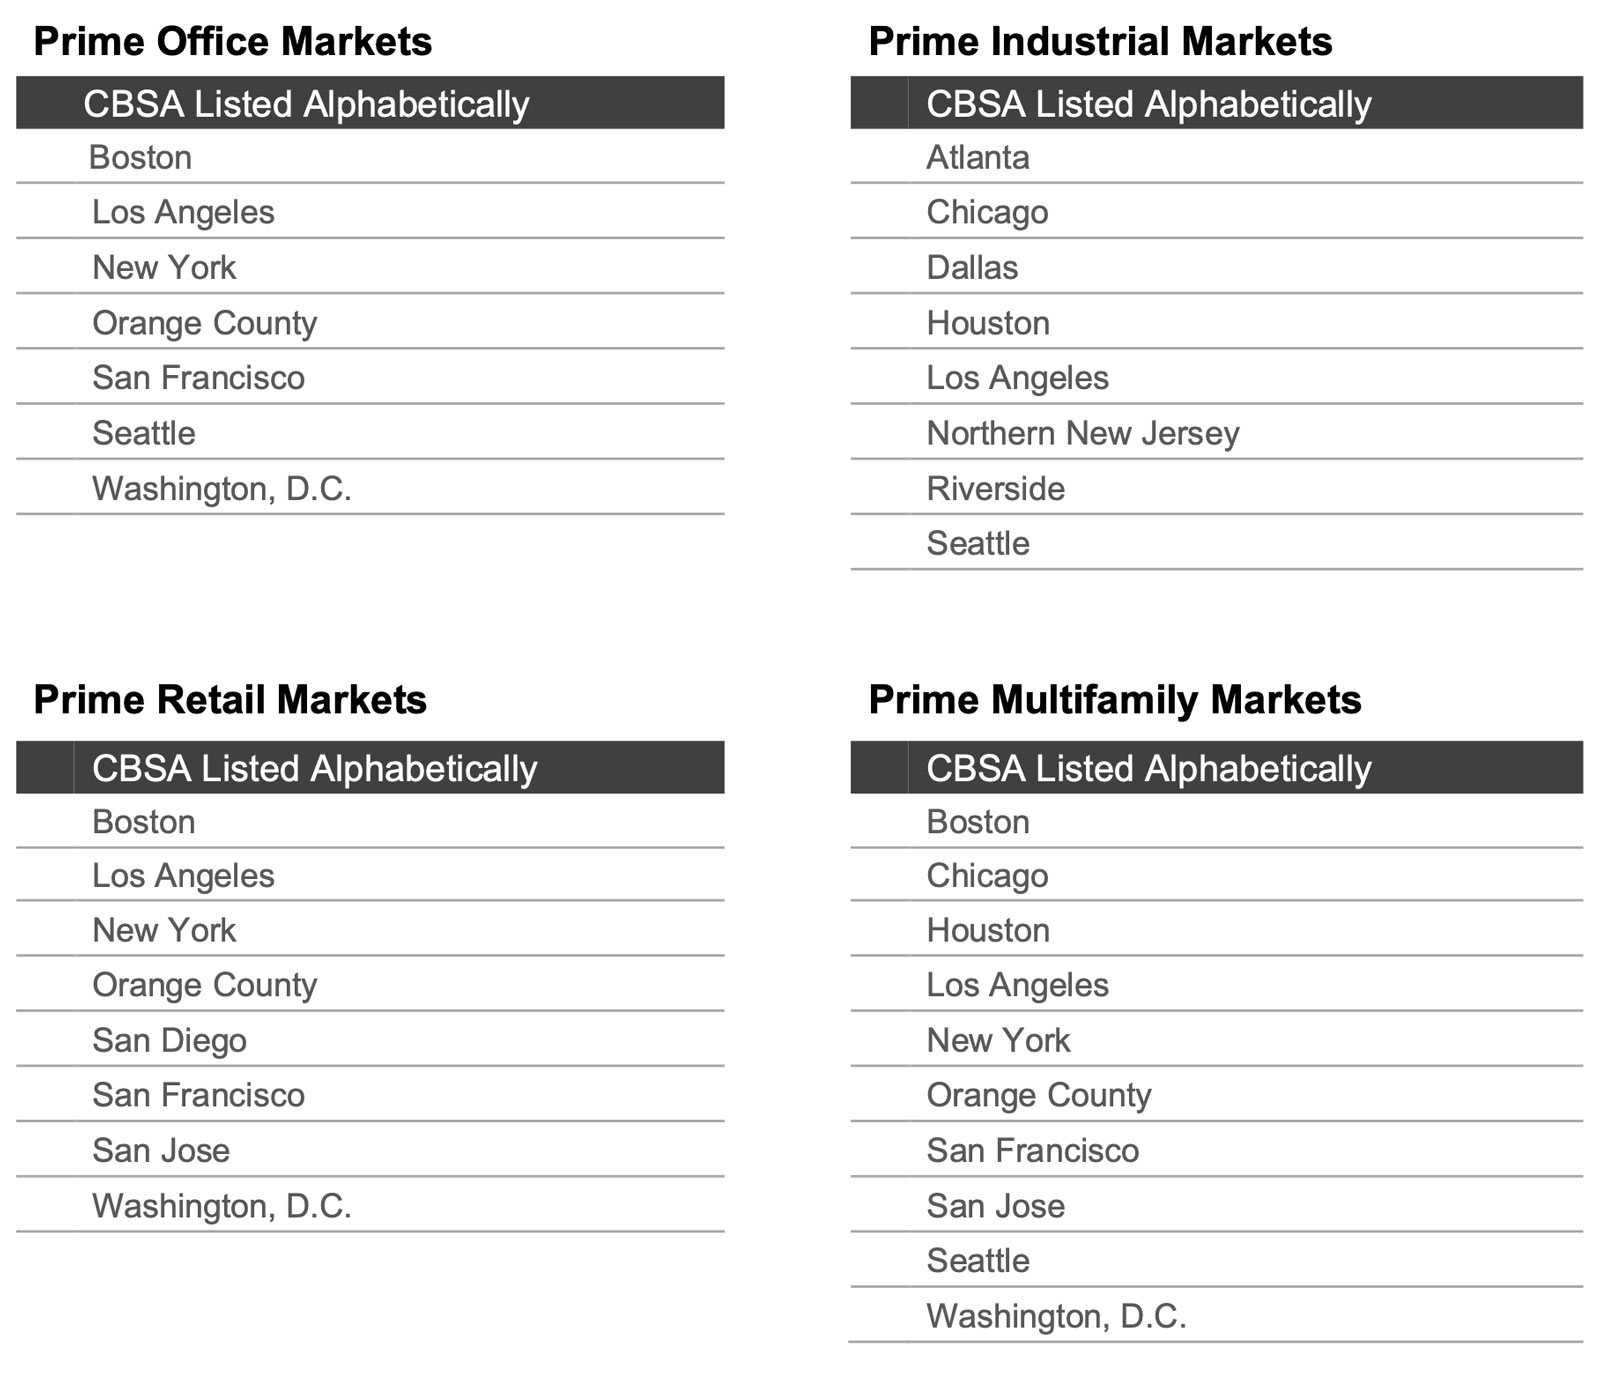
The CoStar Commercial Repeat-Sale Indices (CCRSI) are the most comprehensive and accurate measures of commercial real estate prices in the United States. In addition to the national Composite Index (presented in both equal-weighted and value-weighted versions), national Investment-Grade Index, and national General Commercial Index, which are reported monthly, 30 sub-indices in the CoStar index family are reported quarterly. The sub-indices include breakdowns by property sector (office, industrial, retail, multifamily, hospitality, and land), by region of the country (Northeast, South, Midwest, and West), by transaction size and quality (general commercial, investment-grade), and by market size (composite index of the prime market areas in the country). The CoStar indices are constructed using a repeat-sales methodology, widely considered the most accurate measure of real estate price changes. This methodology measures movements in commercial property prices by collecting data on actual transaction prices. When a property is sold more than once, a sales pair is created. The prices from the first and second sales are then used to calculate the property’s price movement. The aggregated price changes from all the sales pairs are used to create a price index. Historical price indices are revised as new data is recorded.
MEDIA CONTACT:
Matthew Blocher, Vice President, CoStar Group Corporate Marketing & Communications (mblocher@costar.com).
For more information about the CCRSI Indices, including the complete accompanying data set and research methodology, legal notices and disclaimer, please visit http://costargroup.com/costar-news/ccrsi.
ABOUT COSTAR GROUP
CoStar Group (NASDAQ: CSGP) is a global leader in commercial real estate information, analytics, online marketplaces, and 3D digital twin technology. Founded in 1986, CoStar Group is dedicated to digitizing the world’s real estate, empowering all people to discover properties, insights, and connections that improve their businesses and lives.
CoStar Group’s major brands include CoStar, a leading global provider of commercial real estate data, analytics, and news; LoopNet, the most trafficked commercial real estate marketplace; Apartments.com, the leading platform for apartment rentals; Homes.com, the fastest-growing residential real estate marketplace; and Domain, one of Australia’s leading property marketplaces. CoStar Group’s industry-leading brands also include Matterport, a leading spatial data company whose platform turns buildings into data to make every space more valuable and accessible; STR, a global leader in hospitality data and benchmarking; Ten-X, an online platform for commercial real estate auctions and negotiated bids; and OnTheMarket, a leading residential property portal in the United Kingdom.
CoStar Group’s websites attracted over 131 million average monthly unique visitors in the first quarter of 2026, serving clients around the world. Headquartered in Arlington, Virginia, CoStar Group is committed to transforming the real estate industry through innovative technology and comprehensive market intelligence. From time to time, we plan to utilize our corporate website as a channel of distribution for material company information. For more information, visit CoStarGroup.com.
This news release includes "forward-looking statements" including, without limitation, statements regarding CoStar's expectations, beliefs, intentions or strategies regarding the future. These statements are based upon current beliefs and are subject to many risks and uncertainties that could cause actual results to differ materially from these statements. The following factors, among others, could cause or contribute to such differences: the risk that the trends represented or implied by the indices will not continue or produce the results suggested by such trends, including trends related to commercial real estate fundamentals, price growth and liquidity measures; and the risk that transaction volume, investor demand, market supply, and commercial real estate pricing levels and growth will not continue at the levels or with the trends indicated in this release. More information about potential factors that could cause results to differ materially from those anticipated in the forward-looking statements include, but are not limited to, those stated in CoStar’s filings from time to time with the Securities and Exchange Commission, including in CoStar’s Annual Report on Form 10-K for the year ended December 31, 2025, and CoStar’s Quarterly Report on Form 10-Q for the quarter ended March 31, 2026, each of which is filed with the SEC, including in the “Risk Factors” section of those filings, as well as CoStar’s other filings with the SEC available at the SEC’s website (www.sec.gov). All forward-looking statements are based on information available to CoStar on the date hereof, and CoStar assumes no obligation to update or revise any forward-looking statements, whether as a result of new information, future events or otherwise.