AVERAGE DAYS ON MARKET FELL IN JANUARY 2026
CCRSI RELEASE – January 2026
(With data through December 2025)
Print Release (PDF)
This month's CoStar Commercial Repeat Sale Indices (CCRSI) provides the market's first look at commercial real estate pricing trends through January 2026. Based on 1,298 repeat sale pairs in January 2026 and 340,290 repeat sales since 1996, the CCRSI offers the broadest measure of commercial real estate repeat sales activity.
CCRSI National Results Highlights
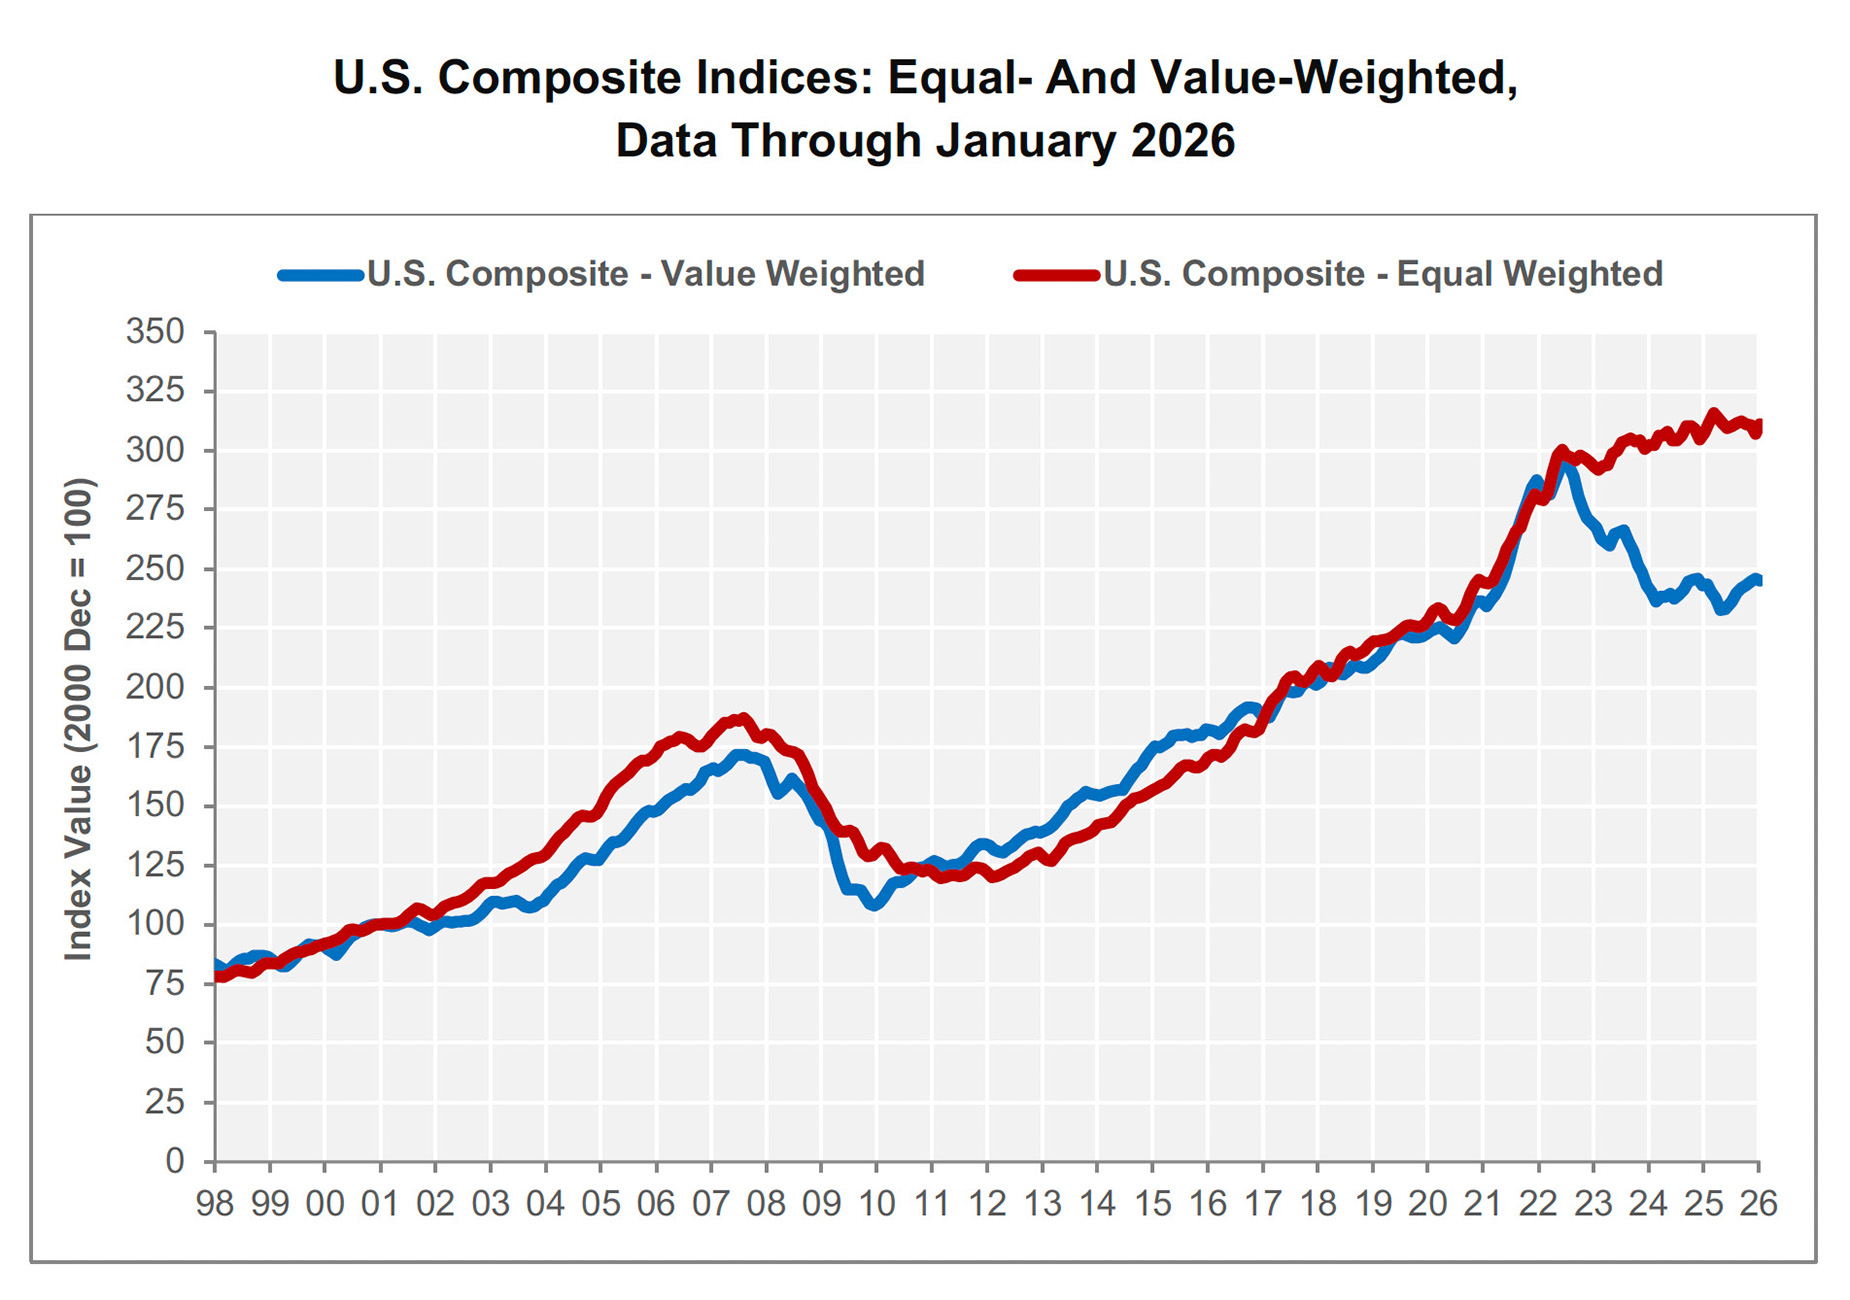
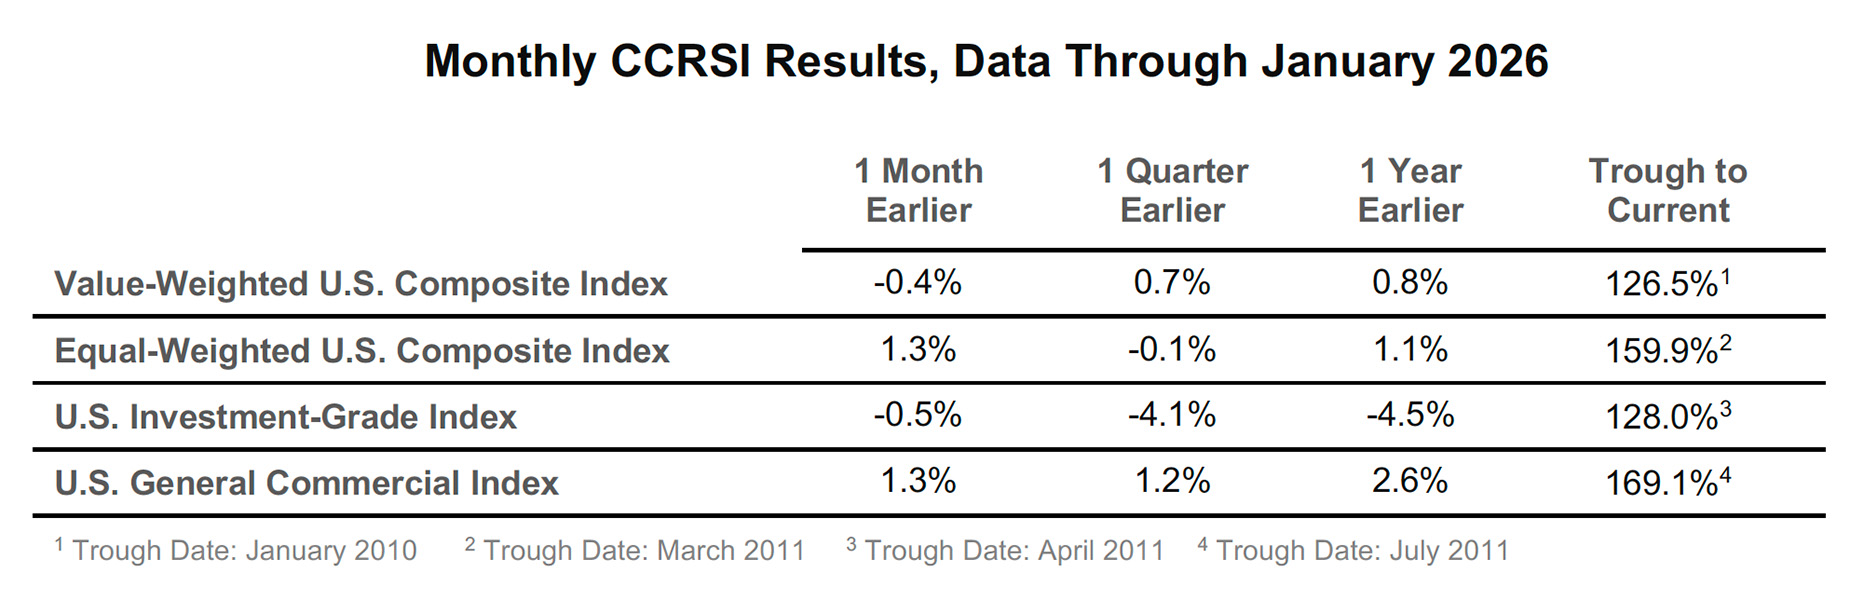
- U.S. COMPOSITE PRICE INDICES DIVERGED IN JANUARY 2026. The value-weighted U.S. Composite Index, which is more heavily influenced by high-value trades common in core markets, slipped to 245, declining 0.4% over December 2025. Year-over-year values rose, increasing 0.8% January 2026 compared to January 2025. Compared to the all-time high in July 2022, the value-weighted index was lower by 17% in January 2026.
- Meanwhile, the equal-weighted U.S. composite index, which reflects the more numerous but lower-priced property sales typical of secondary and tertiary markets, increased 1.3% to 311 in January 2026. The index rose 1.1% in the 12 months ending in January 2026 and was 1.5% below the March 2025 high.
- Repeat sale prices in January 2026 marked the fourth consecutive divergence between the equal and value-weighted indices. January 2026 may prove to be a countertrend print; the recent bias has been a decline in equal-weighted prices with an upward bias in the value-weighted segment.
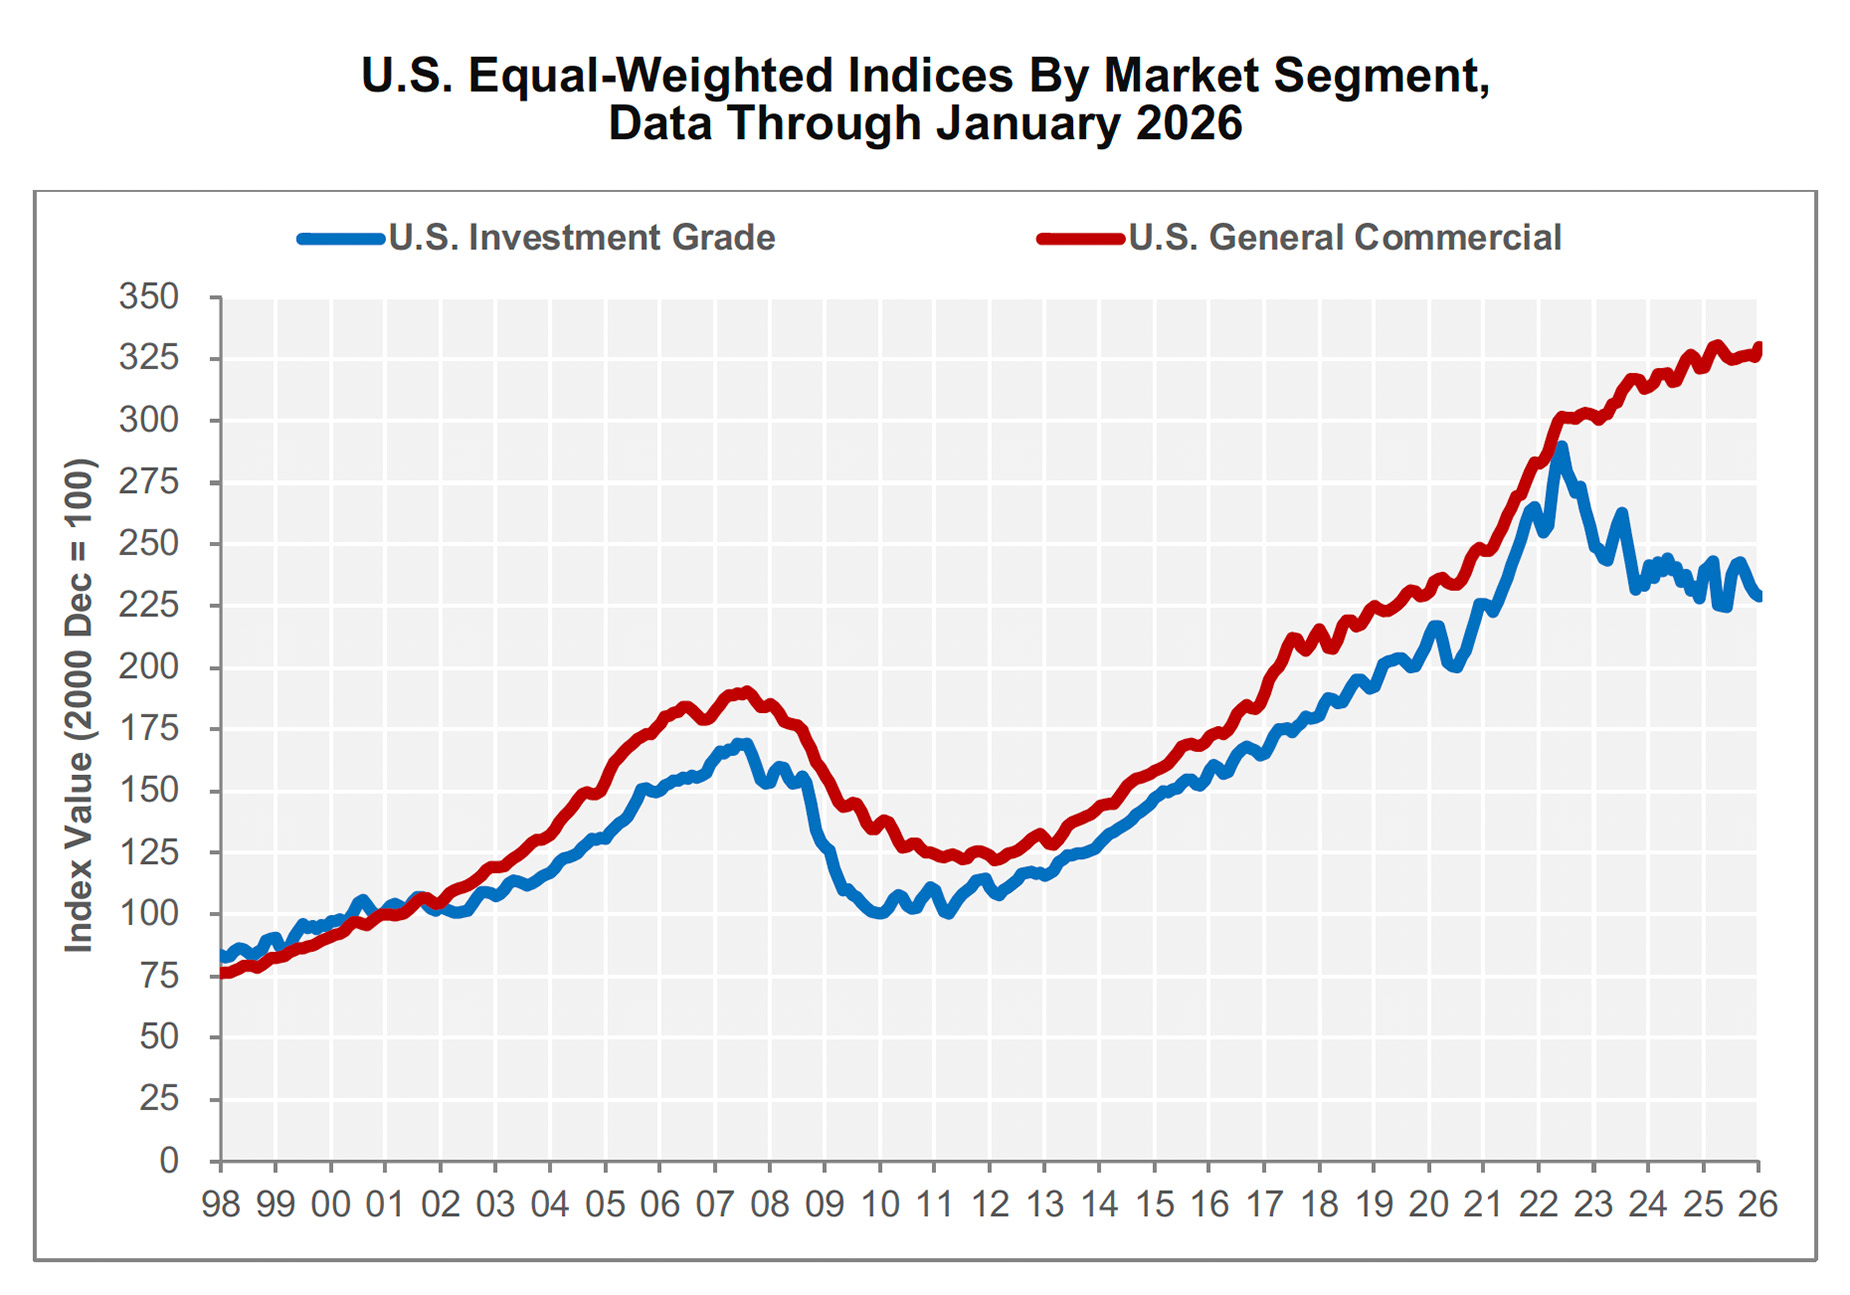
- INVESTMENT GRADE PRICES FELL IN JANUARY 2026. The equal-weighted index’s sub-components, investment grade and general commercial, also diverged over the prior month in January 2026 after both were negative over the prior month in December 2025.
- The investment grade sub-index, more heavily influenced by higher-value assets, fell 0.5% in January 2026 compared to December 2025. Year-over-year values sank 4.5% in the 12 months ending in January 2026. The cumulative change in this sub-index extended losses to 21% below the June 2022 all-time high.
- The general commercial sub-index, more heavily influenced by smaller, lower-priced assets, jumped 1.3% higher in January 2026 compared to December 2025. This sub-index rose 2.6% over the 12 months ending January 2026 and stood 0.2% below the April 2025 all-time high.
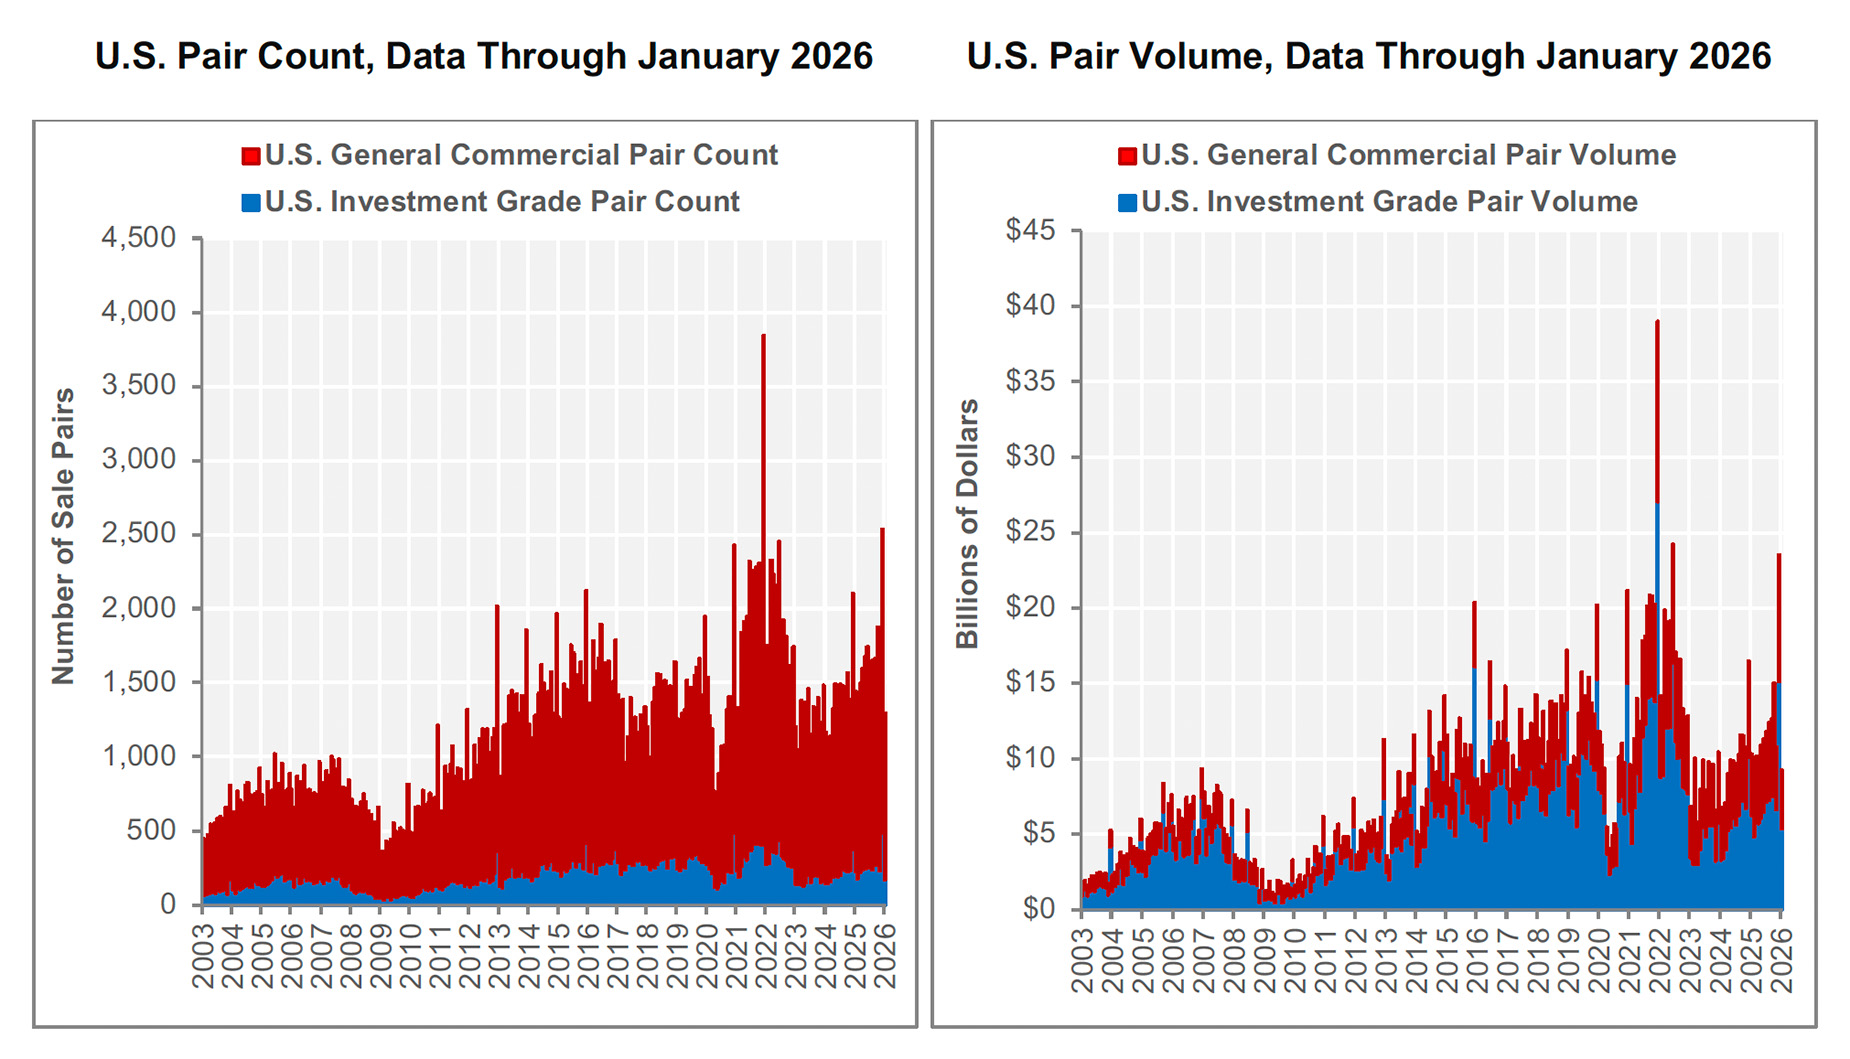
- REPEAT SALE TRANSACTIONS DECLINED COMPARED TO JANUARY 2025. The number of repeat sales fell by 143 transactions compared to January 2025. With 1,298 repeat sales, the total consideration in January 2026 was $9.2 billion, representing a 10.4% decrease over the prior year. Investment grade transaction volume declined 14.3% in January 2026 compared to the prior year reaching $5.4 billion. The general commercial segment fell 4.4% below the prior year to $3.9 billion.
- Composite pair volume of $146.8 billion during the 12 months ending in January 2026 was 19.9% above the 12-month period that ended in January 2025. The growth in sales volume was more prominent in the general commercial segment, which increased 22.4% over the 12 months that ended in January 2026 compared to the same period ending in January 2025. The general commercial segment accounted for 42% of the overall transaction volume during the 12 months that ended in January 2026. The investment grade segment, which accounted for 58% of the 12-month transaction volume, increased 18.1% over the 12 months ending in January 2026.
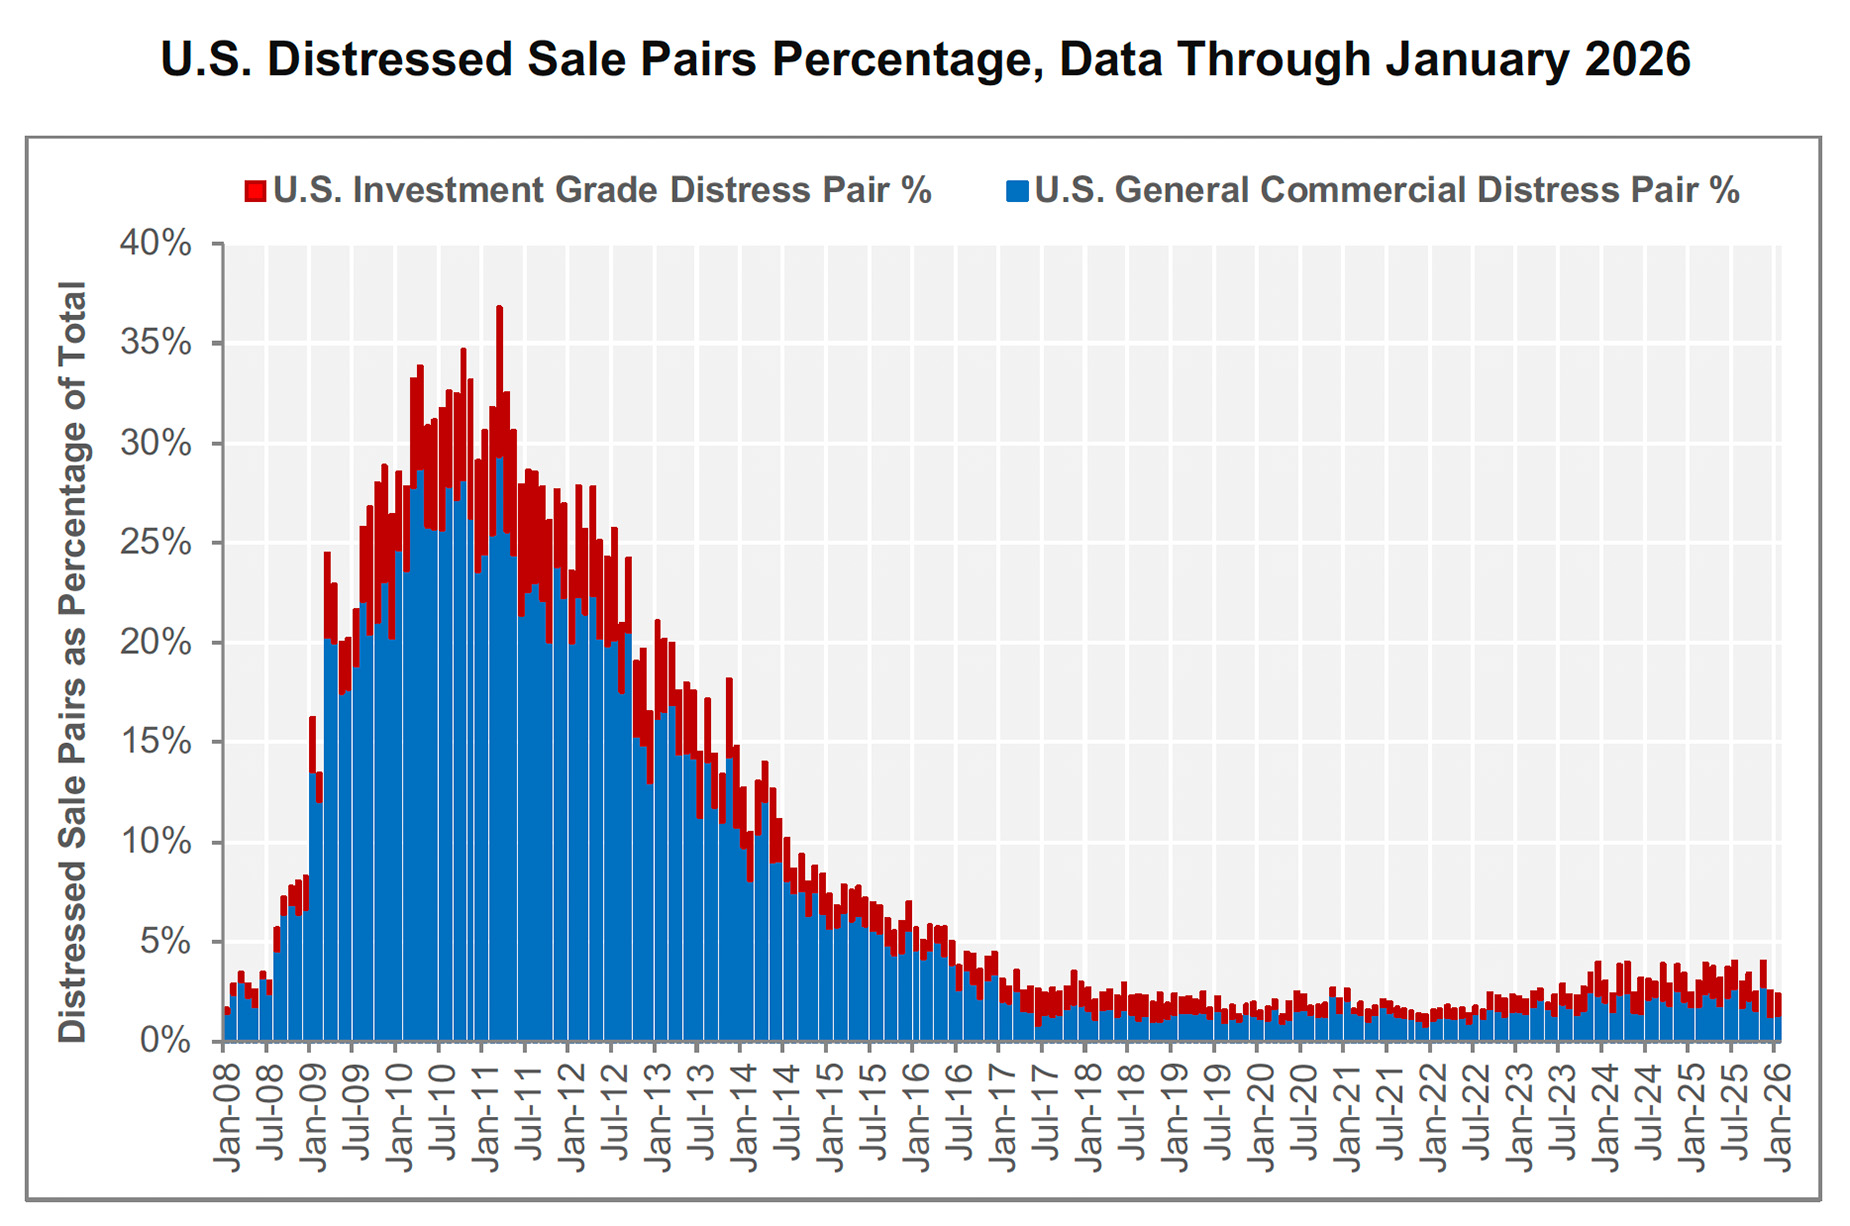
- DISTRESSED REPEAT SALES FELL IN JANUARY 2026. A total of 31 repeat sales out of the 1,298 trades in January 2026, or 2.4%, were distressed sales. General commercial distressed sales accounted for 17 of the trades in January 2026, or 1.5% of general commercial repeat-sale trades. Fourteen investment-grade distressed sales were recorded in January 2026, accounting for 8.2% of investment grade repeat sales.
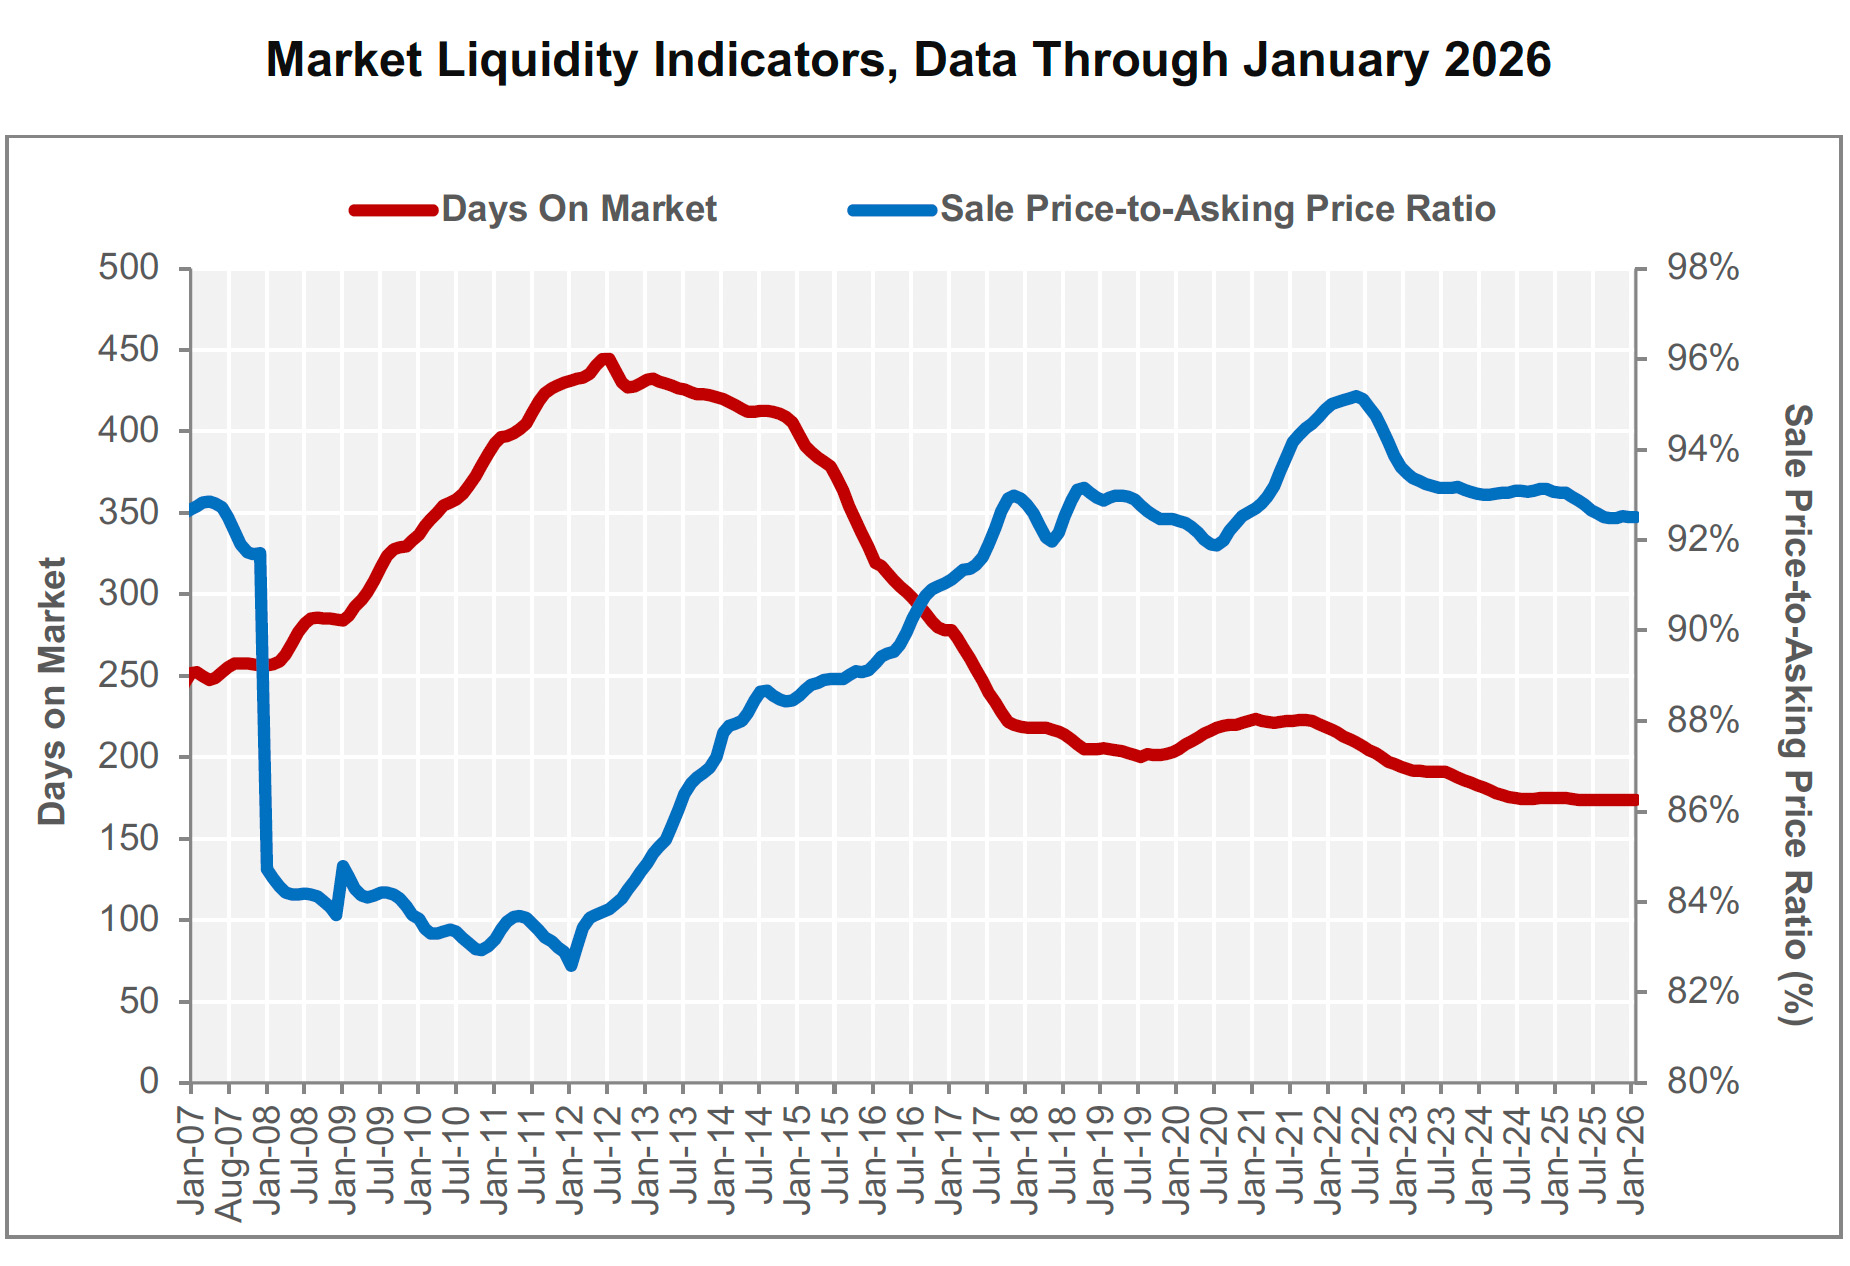
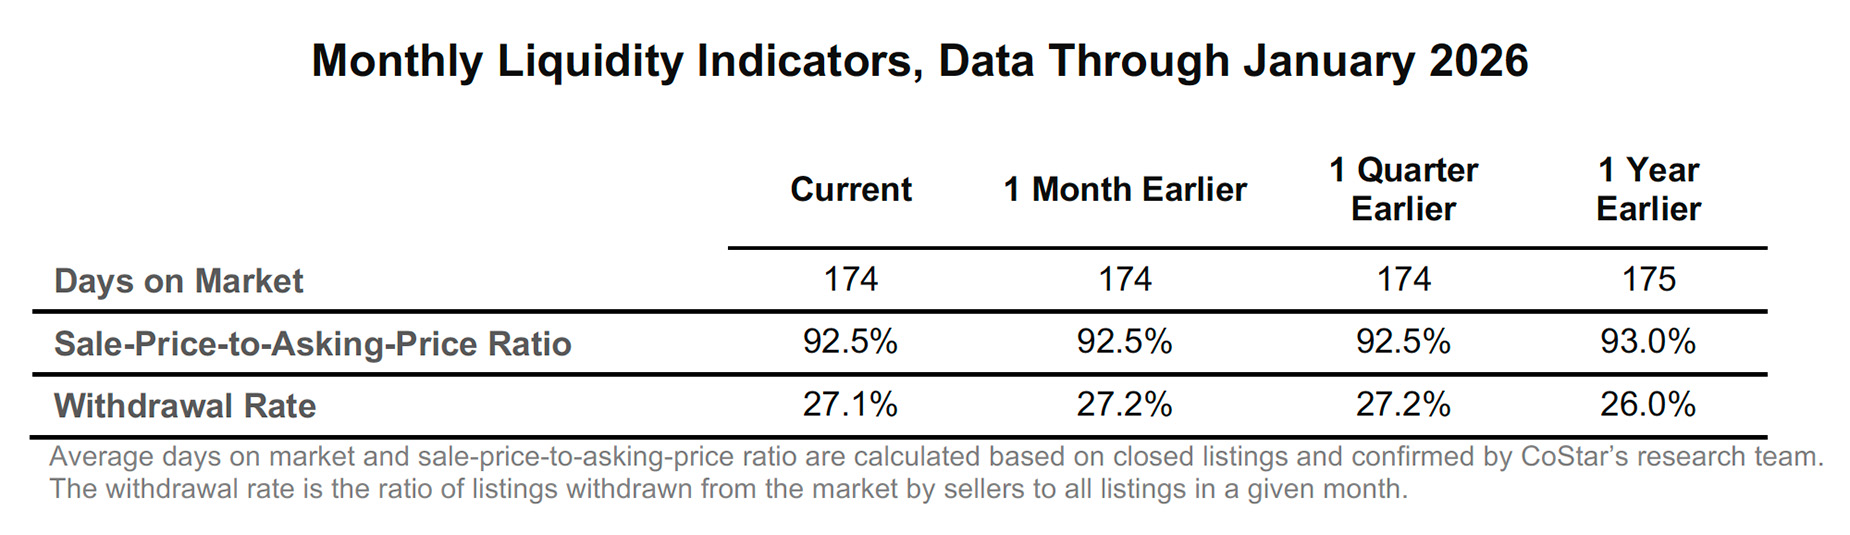
- THE AVERAGE TIME ON MARKET SHRANK IN JANUARY 2026. The average time on the market of for-sale properties fell by 0.6% to 174 days in the 12 months ending in January 2026 compared to the 12 months ending in January 2025, as the sale price-to-asking-price ratio fell to 92.5% in the same period. At the same time, the share of properties withdrawn from the market by discouraged sellers rose to 27.1% in January 2026 compared to January 2025.
About The CoStar Commercial Repeat-Sale Indices
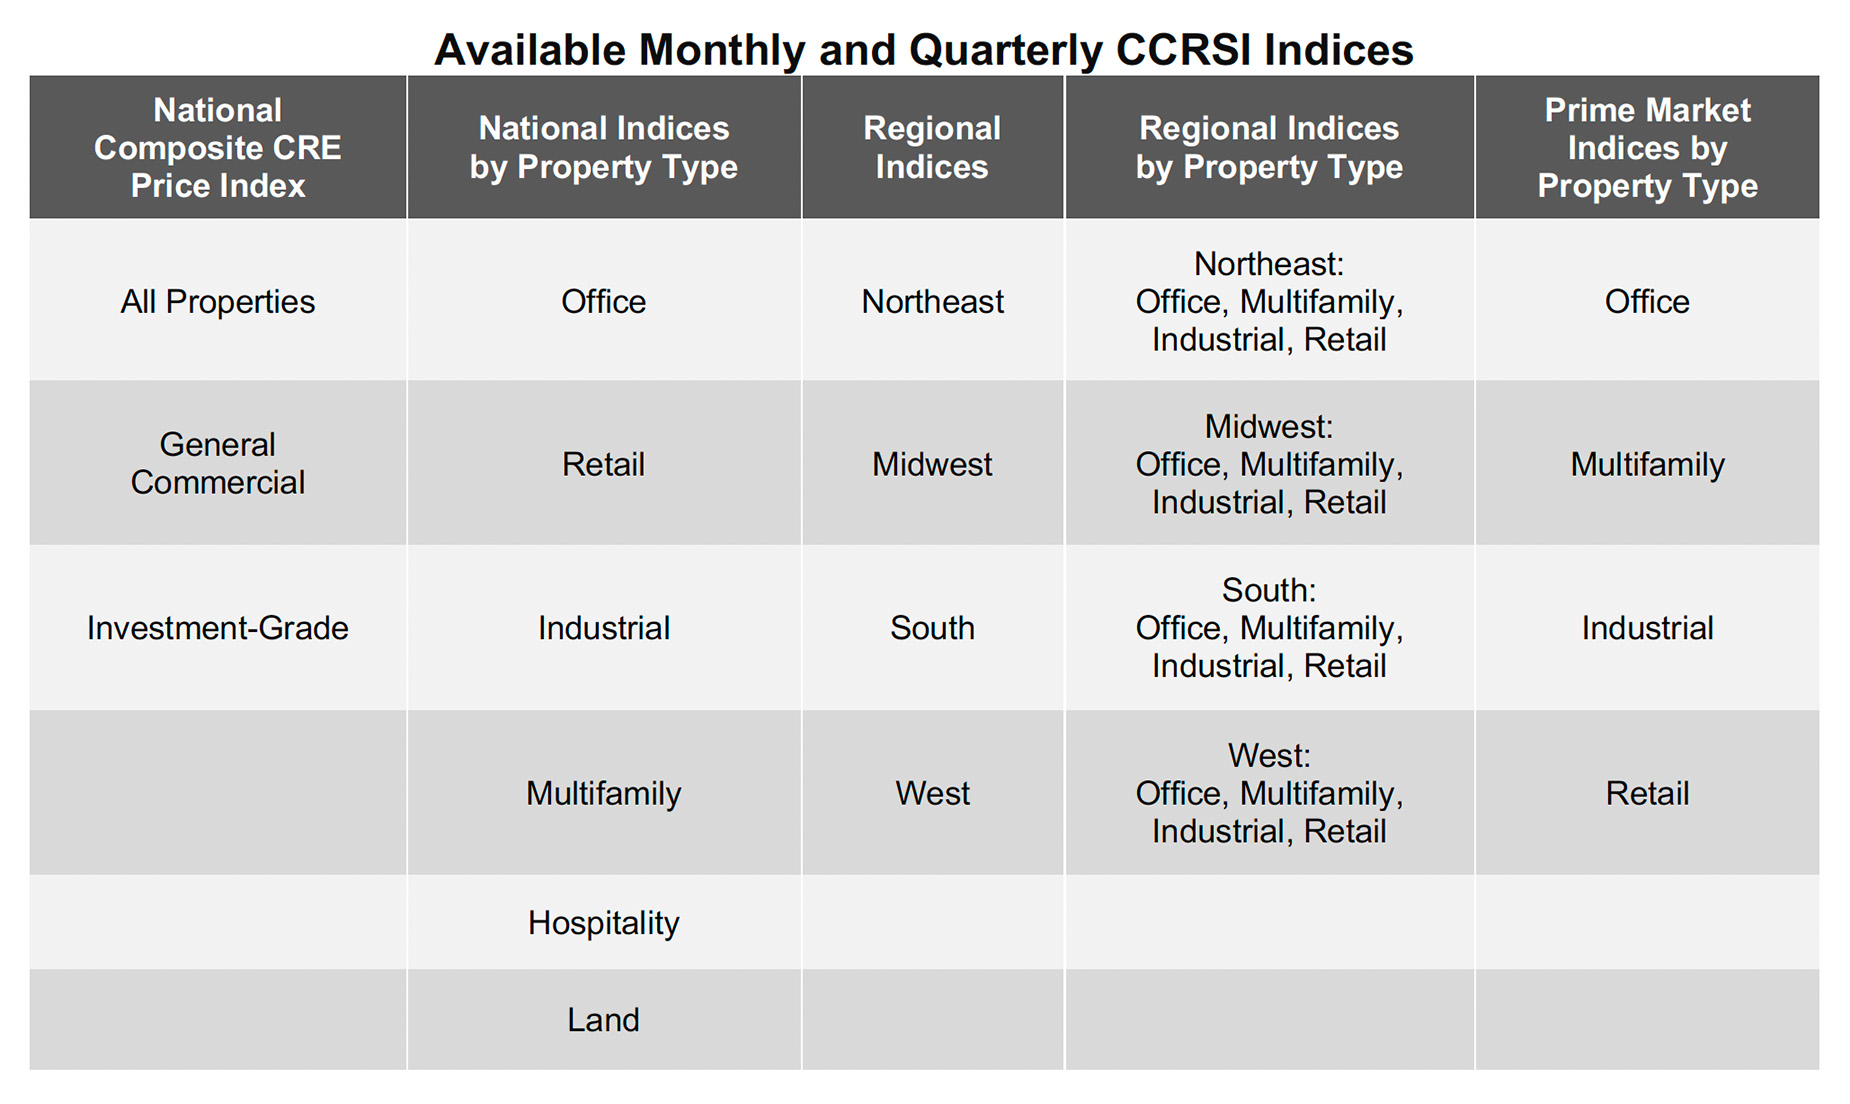
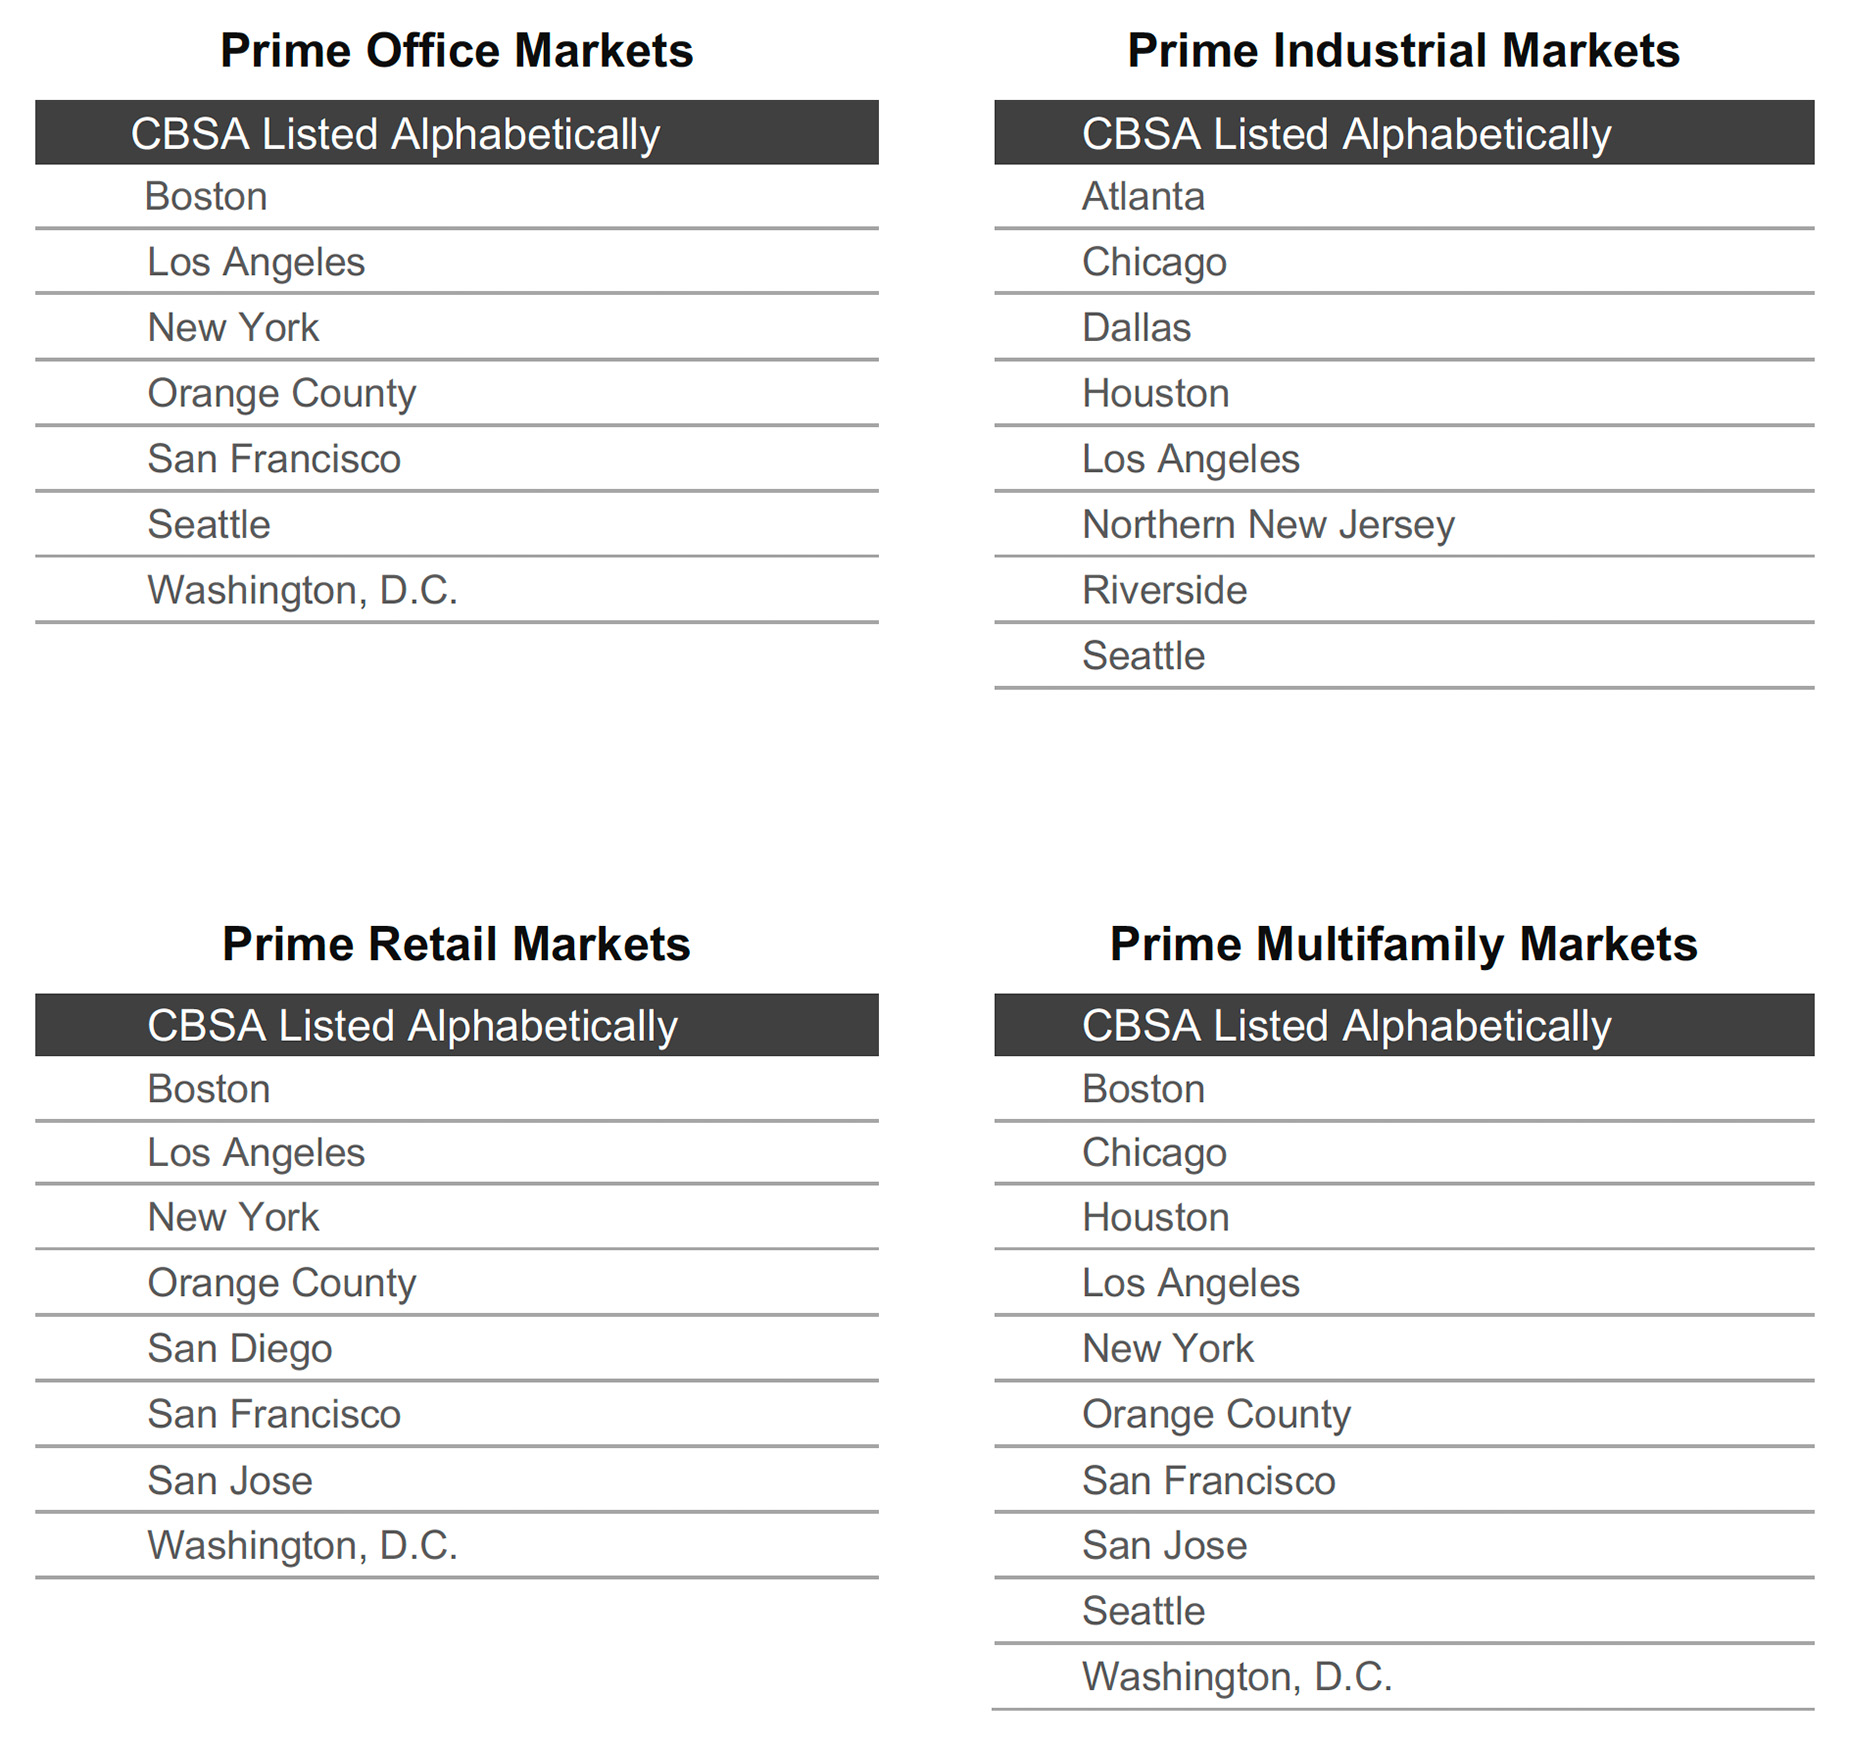
The CoStar Commercial Repeat-Sale Indices (CCRSI) are the most comprehensive and accurate measures of commercial real estate prices in the United States. In addition to the national Composite Index (presented in equal-weighted and value-weighted versions), national Investment-Grade Index, and national General Commercial Index, reported monthly, 30 sub-indices in the CoStar index family are reported quarterly. The sub-indices include breakdowns by property sector (office, industrial, retail, multifamily, hospitality, and land), by region of the country (Northeast, South, Midwest, and West), by transaction size and quality (general commercial, investment-grade), and by market size (composite index of the prime market areas in the country). The CoStar indices are constructed using a repeat sales methodology, widely considered the most accurate measure of price changes for real estate. This methodology measures the movement in the prices of commercial properties by collecting data on actual transaction prices. A sales pair is created when a property is sold more than once. The prices from the first and second sales are then used to calculate price movement for the property. The aggregated price changes from all the sales pairs are used to create a price index. Historical price indices are revised as new data is recorded.
MEDIA CONTACT:
Matthew Blocher, Vice President, CoStar Group Corporate Marketing & Communications (mblocher@costar.com).
For more information about the CCRSI Indices, including the full accompanying data set and research methodology, legal notices, and disclaimer, please visit https://costargroup.com/costar-news/ccrsi/.
ABOUT COSTAR GROUP
CoStar Group (NASDAQ: CSGP) is a global leader in commercial real estate information, analytics, online marketplaces, and 3D digital twin technology. Founded in 1986, CoStar Group is dedicated to digitizing the world’s real estate, empowering all people to discover properties, insights, and connections that improve their businesses and lives.
CoStar Group’s major brands include CoStar, a leading global provider of commercial real estate data, analytics, and news; LoopNet, the most trafficked commercial real estate marketplace; Apartments.com, the leading platform for apartment rentals; Homes.com, the fastest-growing residential real estate marketplace; and Domain, one of Australia’s leading property marketplaces. CoStar Group’s industry-leading brands also include Matterport, a leading spatial data company whose platform turns buildings into data to make every space more valuable and accessible; STR, a global leader in hospitality data and benchmarking; Ten-X, an online platform for commercial real estate auctions and negotiated bids; and OnTheMarket, a leading residential property portal in the United Kingdom.
CoStar Group’s websites attracted over 139 million average monthly unique visitors in the fourth quarter of 2025, serving clients around the world. Headquartered in Arlington, Virginia, CoStar Group is committed to transforming the real estate industry through innovative technology and comprehensive market intelligence. From time to time, we plan to utilize our corporate website as a channel of distribution for material company information. For more information, visit www.CoStarGroup.com.